
How I Saved 600 Trades With 1 Simple Filter
Fixing the Most Expensive Inefficiency in My Best Strategy

Hey friends,
I have this strategy that I’ve been trading live since November — and it’s been doing really well. Not only has it contributed the majority of returns to my overall portfolio, it’s been surviving an awful period in crypto markets.
But I’m having an issue with it. Maybe not so much of an issue but rather an inefficiency that I want to fix. This is one of those problems that you either KNOW about intuitively when you’re building a strategy, or you discover when you trade it day after day.
So this model is very noisy at the boundary of trade selection.
What do I mean by this?
Imagine that you want to hold a maximum of 20 positions on a specific portfolio.
On average, the 20th position is a weak signal, no different than the 21st. But you take the 20th because it ranks higher than the 21st. Now, tomorrow the weak signal of that 21st position becomes a tiny bit stronger and now it’s the 20th position. So you shift your book from a full position of yesterday’s 20th, to today’s new 20th.
You can see where I’m going with this. We can easily estimate that the edge increase in this case is meaningless — it’s not like that small increase in ranking is going to meaningfully change the average outcome of that positioning. Which means we’re paying full cost of trade execution for a trade we don’t get paid to do.
The strategy does well on its own on a historical test, and the live performance has shown that too. But I believe this behavior can be optimized.
Digging Into the Data
Let’s start by plotting out the data. This is a use case you can use AI for — take the data your backtests generate, pass it through Claude or any other LLM, and direct it to the thing you want to explore. In this case, churn and costs.
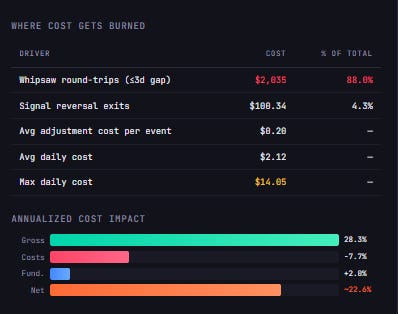
The annualized drag of costs for this strategy is around 7.7% and the median hold of a position is 2 days.
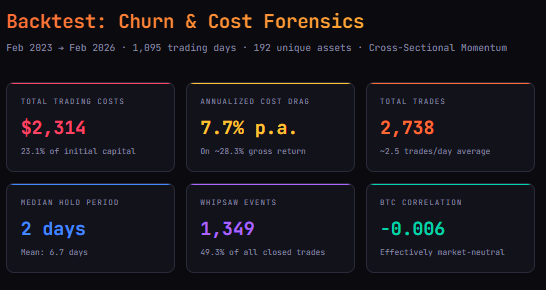
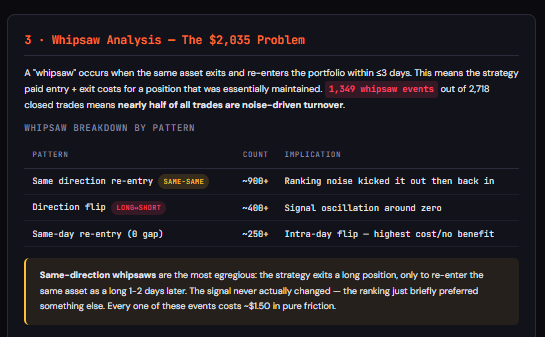
We can also see that the VAST majority of these costs — almost 90% — comes from round trips during that 3-day window. That seems awfully inefficient for the type of strategy that this is.
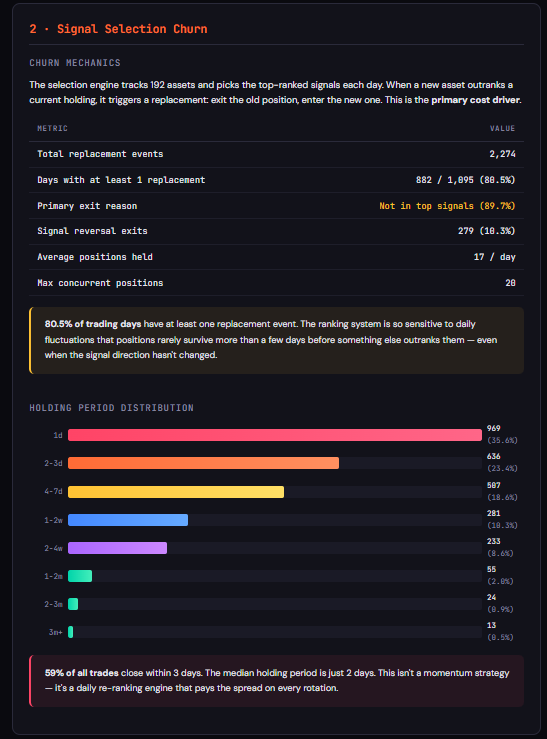
If we dig even closer into the type of exits generating the most churn, we see that 90% of the exits — their primary reason is that they’re not in the top signals for that day.
Now, that might be a reasonable exit. If an asset isn’t the highest ranked in a strategy, we don’t want to be in it and should make room for better trades, right? But like I said at the start, we need to ensure that the change in signal is meaningful enough so that the edge we’re getting from executing that trade is enough to overcome costs.
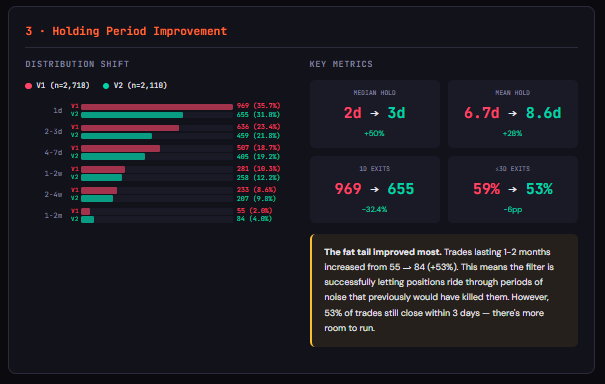
Another important data point: 59% of trades closed within that 3-day period. On a low frequency strategy like this, that might not be optimal. Almost certainly not the 35% of trades that close on that 1-day period.
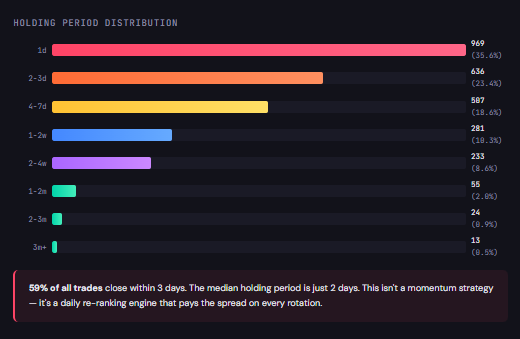
Another interesting data point — over 900 trades re-enter within a 3-day period. Meaning the asset drops from that top 20 list, and then the other day a tiny adjustment makes it get back to 20 again and we issue a full rebalance once more.
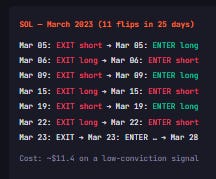
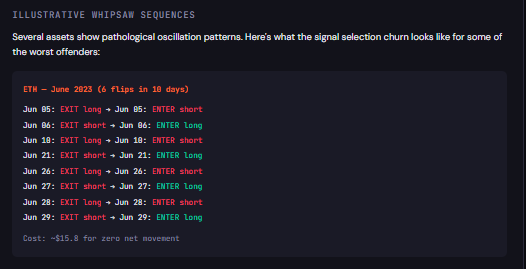
Look at this concrete example. ETH in June 2023 — see how many times we enter and exit back and forth. 6 flips in 10 days for a cost of ~$15.8 and zero net movement. But this is a different problem we might have to deal with later, because it’s whipsawing back and forth from long to short. That might mean we need to also add some EWMA or something to smooth out the signal, because in range-bound environments we don’t want to be whipsawed by these small oscillations.
The Fix: A Buffer Band
Now, let’s get to what matters and try to fix this with the simplest possible implementation for now. Quick win territory.
We’re going to implement a minimum buffer band at the boundary so that for something to enter the top positions, it needs to cross a threshold of signal strength relative to the current holder. Let’s start at 50% for this specific signal. So a new signal needs to be at least 50% stronger to displace a ranking.
Let me describe practically how this works.
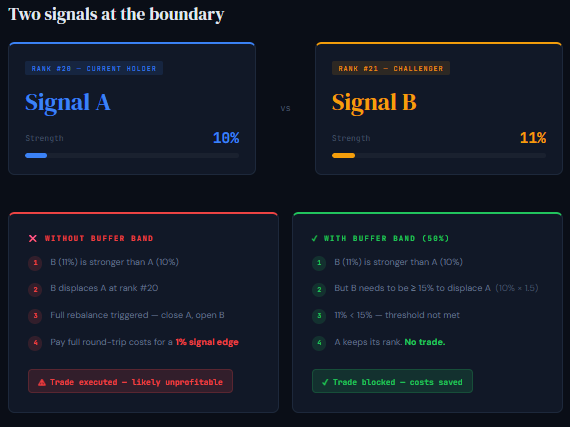
Imagine you have 2 signals, A and B.
A is today’s 20th signal.
B is today’s 21st signal.
Signal A, on a scale of 0 to 1, has a signal strength of 10%. Signal B has a signal strength of 11%. On the old version, signal B would automatically pass to be the 20th signal of the day, issuing a full round trip of the other signal without even knowing if that 10% increase in signal strength is in any way, shape, or form economically worth the round trip.
So what we do is — ok, signal B is indeed stronger, BUT it needs to be at least 50% stronger to issue a full rebalance. Which would require in this case to be 15% strength or higher. In this case, it would not issue the new trade.
The % threshold is completely arbitrary right now, and a more “nerdy” (professional) solution would be to really understand how much you’re getting paid for this exposure after fees and issue the rebalance when it’s higher and with some margin. But today we want a quick and dirty solution that stops us from bleeding money tomorrow, not in 1 month from today.
Let’s see how this works out.
The Results
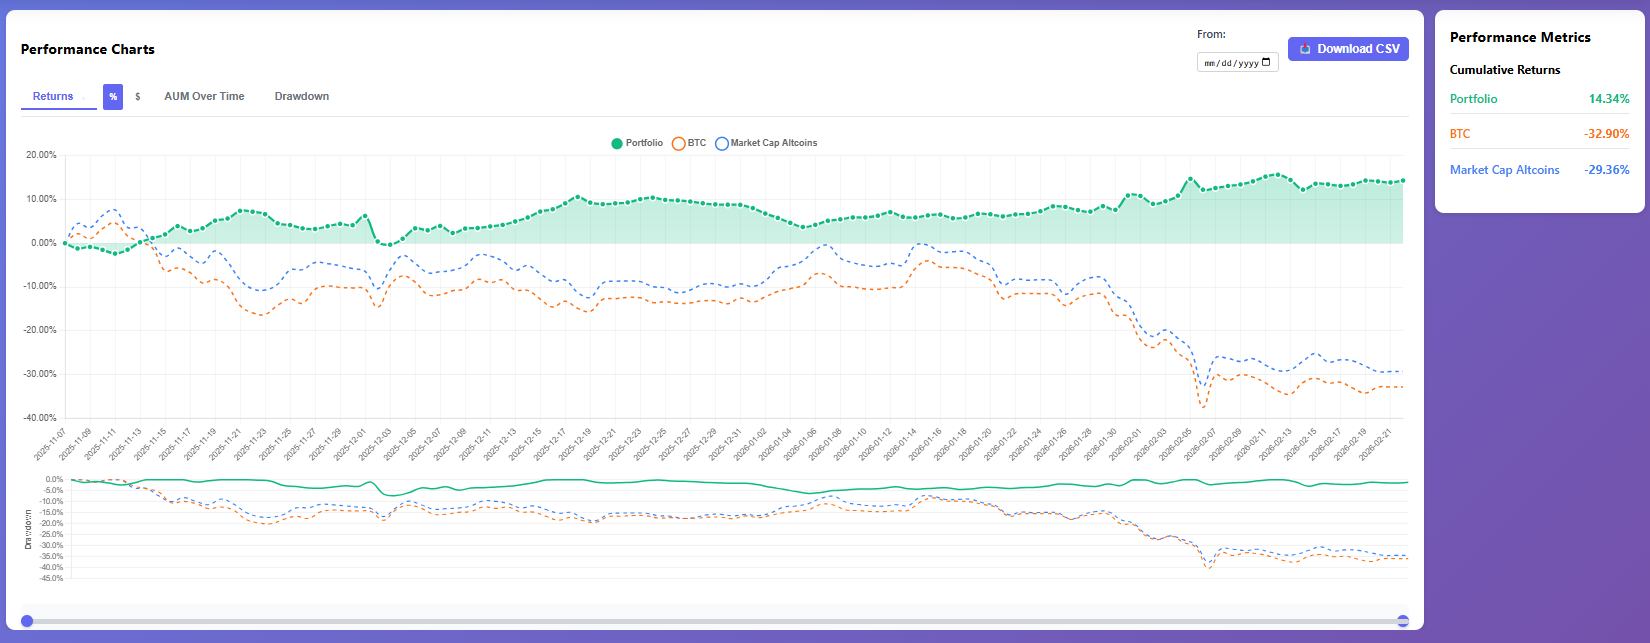
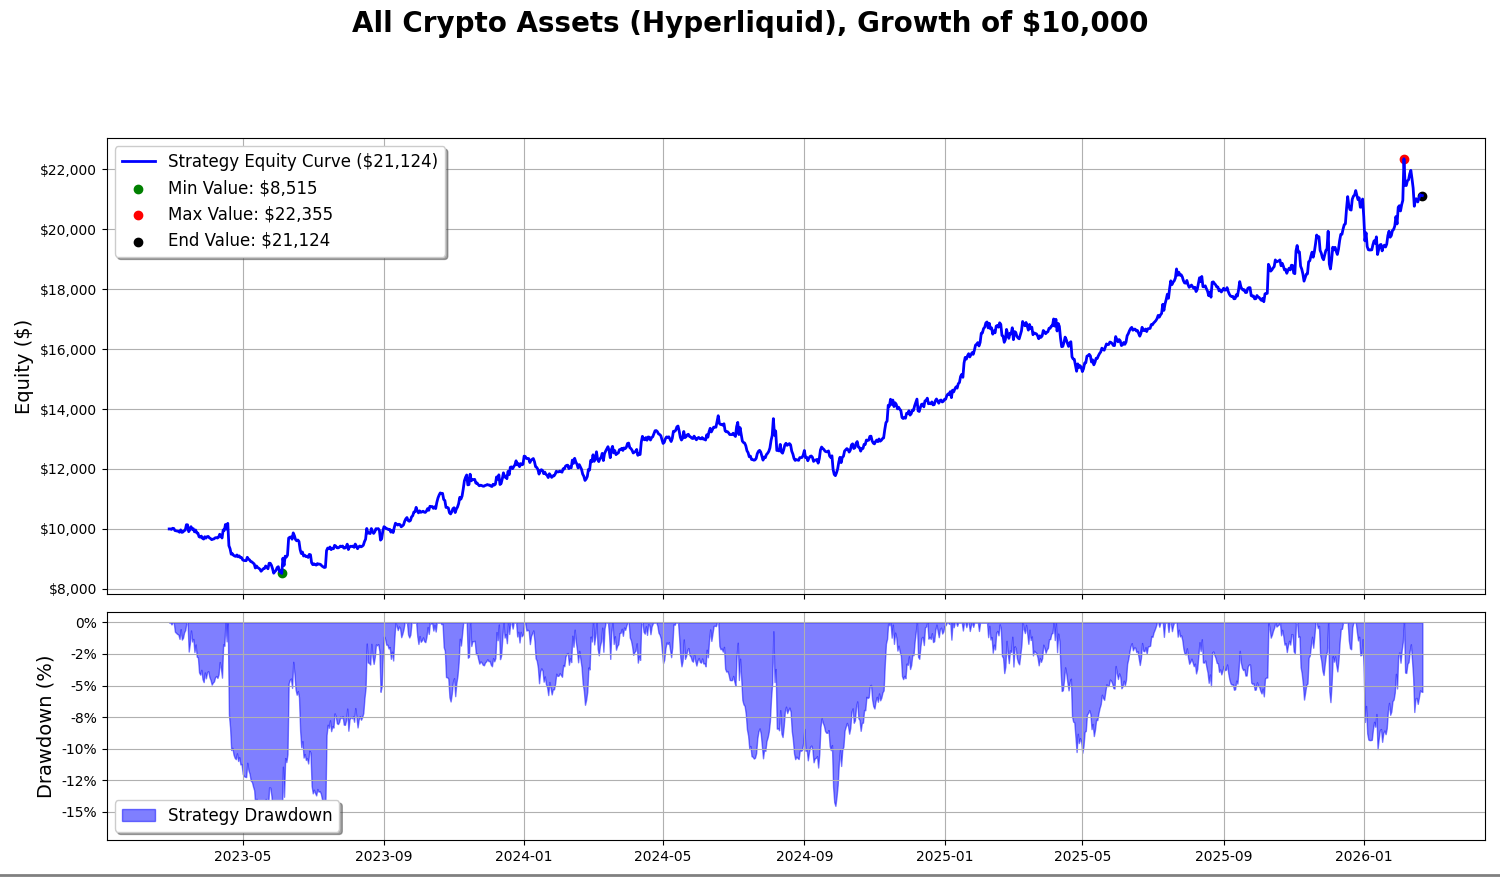
The first thing we see, as expected, is that we save a lot in costs.
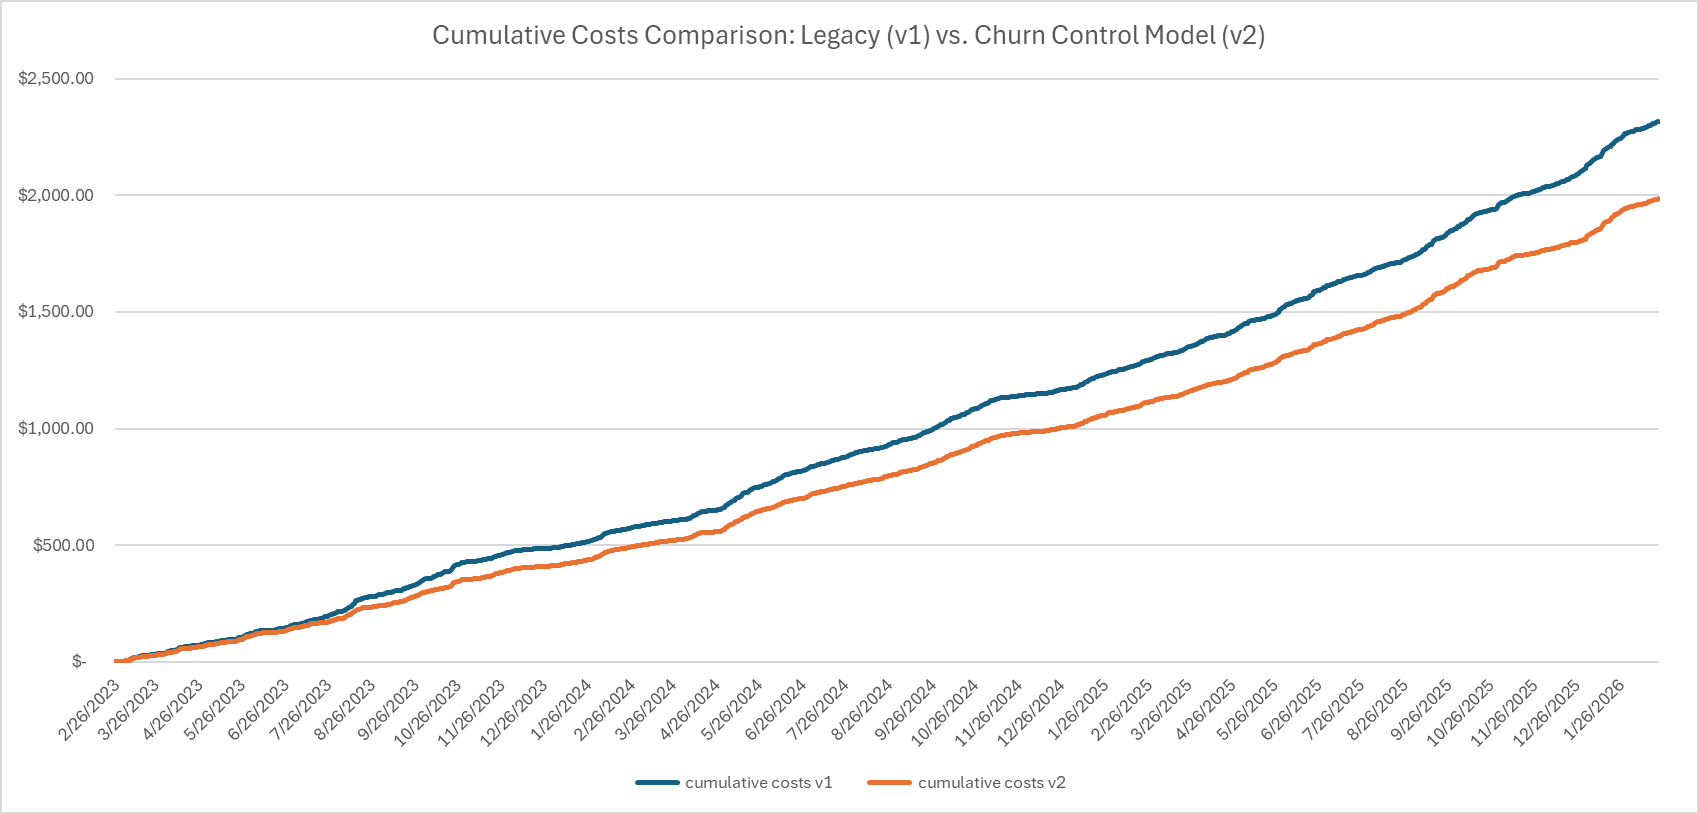
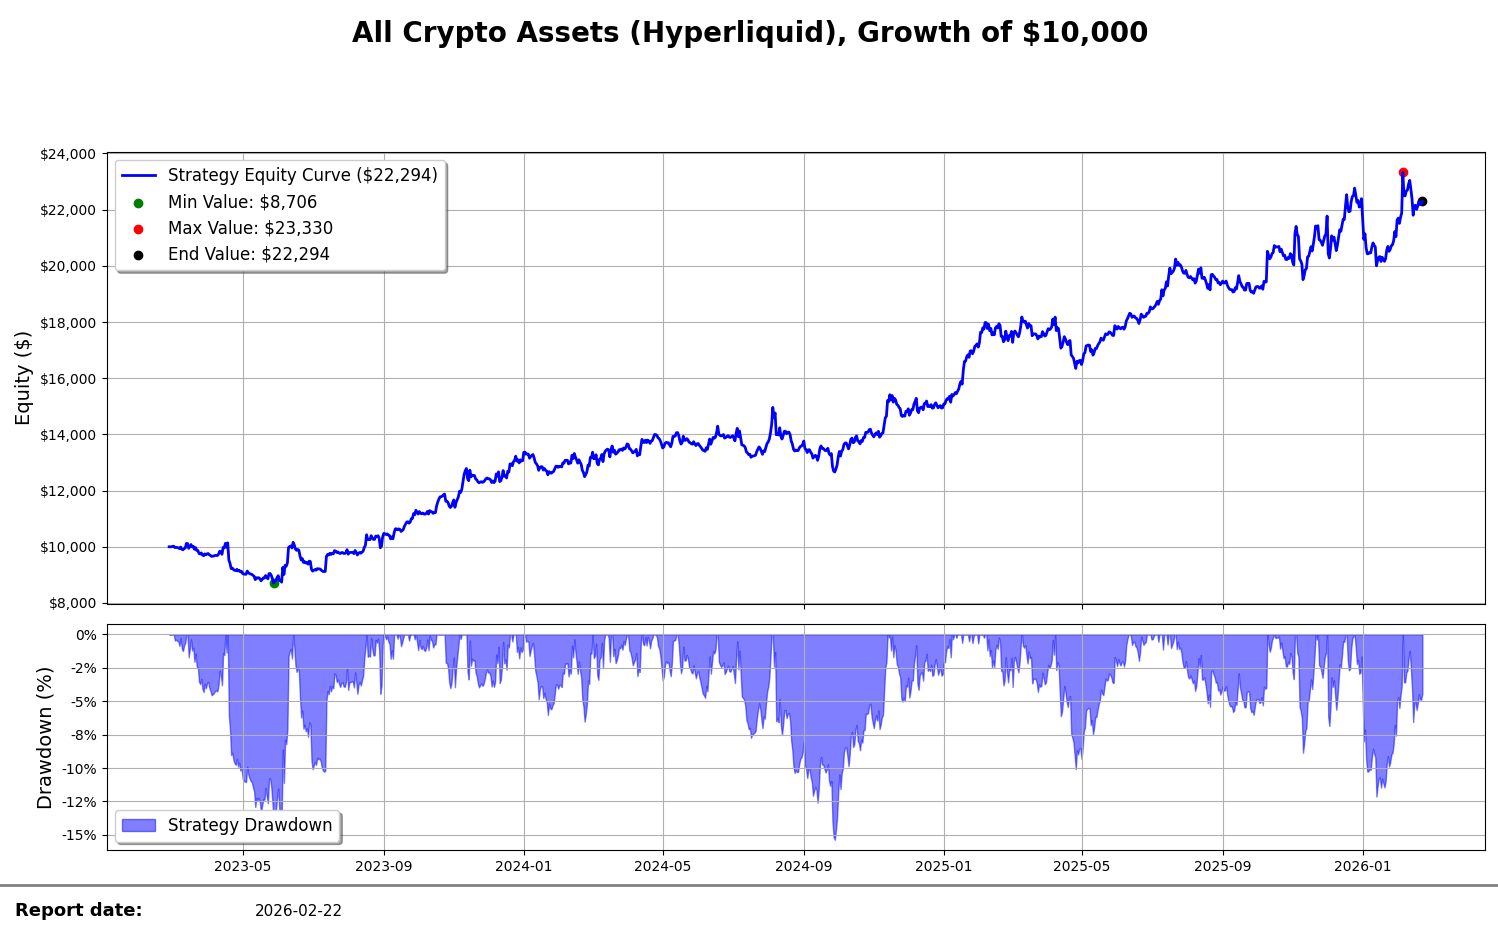
Even through its short history, we can see how the gap between the old legacy model vs the one with the churn control becomes larger and larger. The more time passes, the larger this gap becomes because we’re trading way less.
One thing I want to add here — this doesn’t even factor in the cost saving we get from slippage when crossing the book. Because in lower liquidity assets, and trading on newer exchanges, which I do, this gap becomes even larger.
Now, let’s dashboard this thing out and see the comparison between the old and new model.
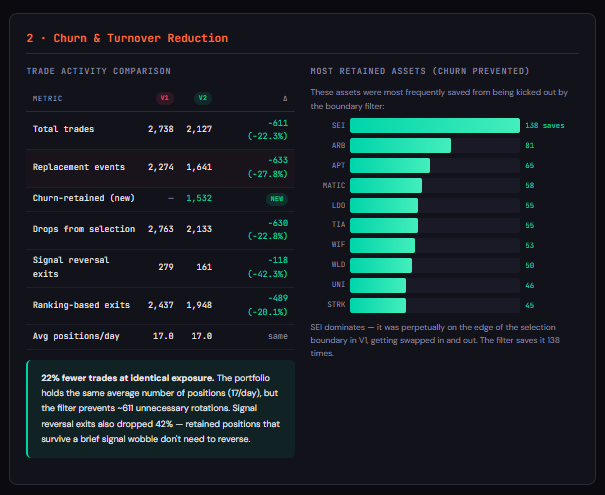
The one that pops out right away is that we slash about 467 whipsaw events (-34%) and we make even more returns than before.
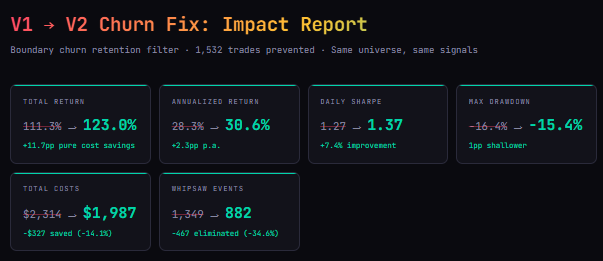
We were also able to reduce our total trading costs by about 15%, and reduce the annual drag to 6.6%. Quite good.
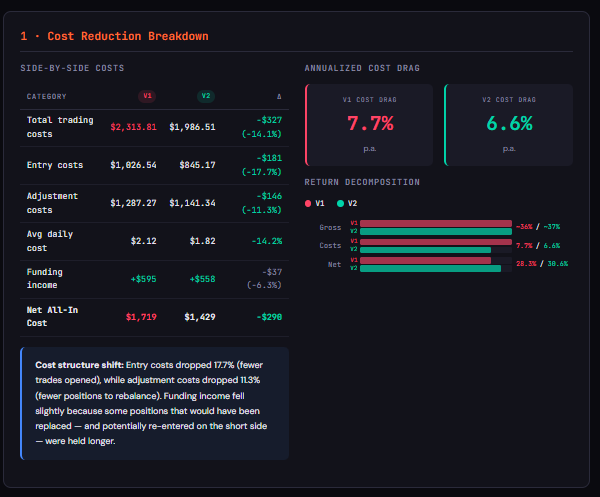
Our total trades decreased by over 600 trades, which is insane. The less we trade and the more we get out of it, the better. If I were to reduce returns and reduce 600 trades, I’d still take that trade any day of the week. Trading costs money, and the impact of those costs is usually higher than what a backtest assumes.
Our median hold also went from 2 days to 3 days. Both the median and the average increased by a lot.
The returns at the end stay relatively stable, which is what we want to see in a truly robust system, with a slight increase in performance.
And that’s how we saved over 600 trades without a decrease in expected performance.
It’s usually always better to decrease the amount of trading done and to be more efficient.
The only guaranteed thing in trading is the cost you pay to trade.
I hope you’ve enjoyed this one!
Disclaimer: The content and information provided by the Trading Research Hub, including all other materials, are for educational and informational purposes only and should not be considered financial advice or a recommendation to buy or sell any type of security or investment. Always conduct your own research and consult with a licensed financial professional before making any investment decisions. Trading and investing can involve significant risk of loss, and you should understand these risks before making any financial decisions.