The Edge of Simplicity: Trend-Following Strategy with SMA Crossovers - Research Article #66
Analyzing shorter-term signals versus traditional longer-term signals.
👋 Hey there, Pedma here! Welcome to the 🔒 exclusive subscriber edition 🔒 of Trading Research Hub’s Newsletter. Each week, I release a new research article with a trading strategy, its code, and much more.
If you’re not a subscriber, here’s what you missed this past month so far:
If you’re not yet a part of our community, subscribe to stay updated with these more of these posts, and to access all our content.
The U.S. stock market crashed more than 20% from the highs of this year.
Amidst all of this uncertainty, one may ask how to trade when conditions are completely volatile and unpredictable?
Well, the only way I know is through a systematic process, with defined rules, so that the guessing work is removed when volatility naturally rises.
Today we are going to present the data for yet another model. A simple model that generated over $274,000, starting from a $10,000 equity in 2017.
The most impressive part of this model is that it achieved similar returns to that of Bitcoin and Altcoins, while at the same time with much smaller drawdowns.
Bitcoin Maximum Drawdown: -83%
Altcoins Benchmark Maximum Drawdown: -93%
Strategy Maximum Drawdown: -32%
It doesn’t only rely on the long side as we’ll see below, but rather trades both the long and short side. This means that even the sharpest downturns can be advantageous for our model.
The full access to the rules of this model are within this this article.
(This article is for informational purposes only and contains hypothetical data. Past performance does not guarantee future results.)
Index
Introduction
Strategy Thesis
Data and Methodology
Performance Analysis
Conclusion
Strategy Thesis
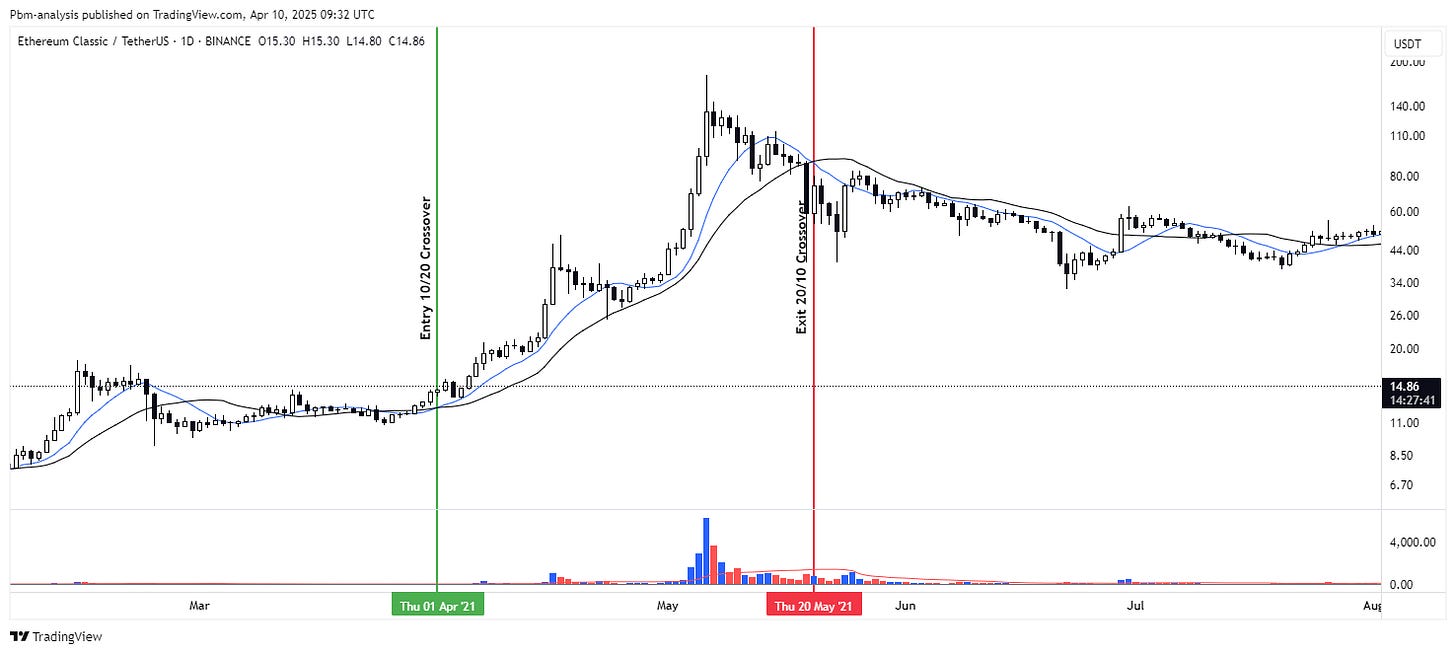
Here’s an example of one of the best trades caught by the chosen iteration of our model. We entered this position on the 1st of April 2021 at $14.32, and exited on the 20th of May 2021 at $73.74, giving us more than 400% gain on a single trade. We didn’t get the absolute top tick, but we did get the bulk of the trend, which is the purpose of this systematic strategy.
If you’re interested in 1-1 consulting with me, I am opening a few spots this year to help traders increase their likelihood of achieving profitability in the markets. If you’re interested, book a free call and ask me any questions: https://cal.com/pedma/15min


