
hey friends,
today I am writing an exploratory article to figure out if and how I can decrease the total cost of my own trading. this will be completely build as we go, so expect some rough sketch until we get to some answer at the end.
there’s not many things we can guarantee when it comes to trading, but one I can guarantee you today is that you’re going to pay a cost each time you trade… either a direct cost like a fee or commission, or an indirect cost like slippage crossing the book. either way, costs are fixed, so perhaps something we can work on.
here’s the turnover of my live trading portfolio.
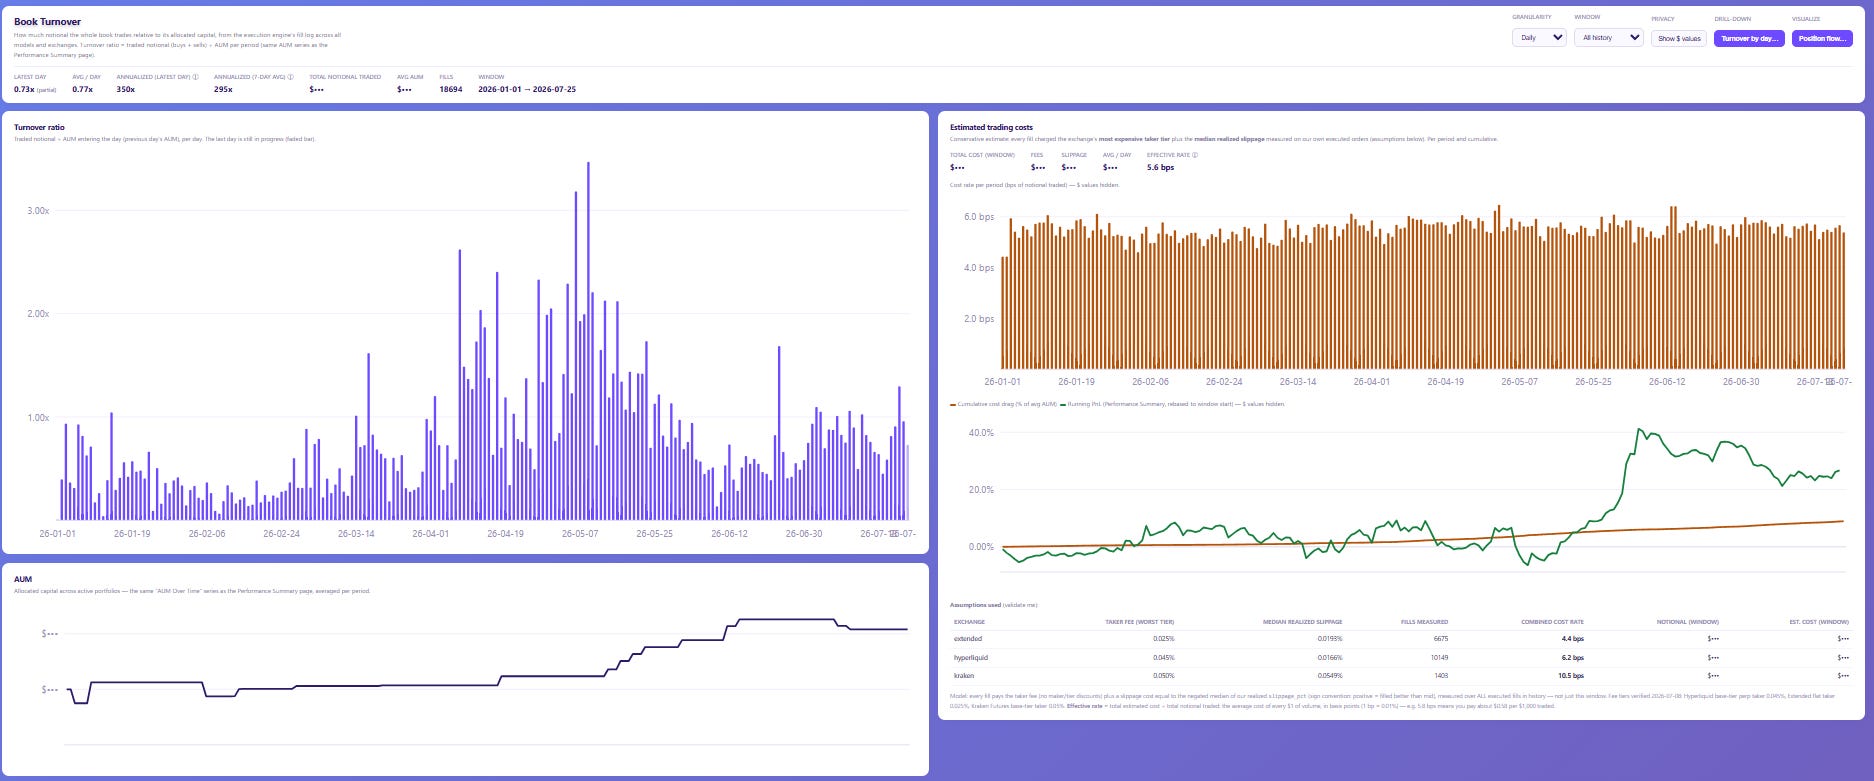
we can see that back in April-May we had really high turnover, much higher than what I wanted it to be. even today, we’re still running at 350x looking at the last day, and 295x looking at the average over the last 7-days. we should be able to improve it because to be honest, I haven’t done much to improve it yet. I did work on the churn at the boundaries of signal selection, but not in any meaningful way.
we have to first look at what drives turnover right, and that’s the formula that tells us how much money we should have on each trade.
so let’s review it.
position_size = ( target_volatility / sqrt(N * (1 + (N-1) * rho)) ) / (asset_volatility * beta_divisor) * total_equity * signal_strengthtarget_volatility— how much risk you want the whole portfolio to carry.divided by a term that accounts for how many trades you’re holding (
N= max signals per day) and how correlated they are (rho) — more trades, or more correlated trades, means each one gets sized down, because they’re not truly independent risk.divided by the asset’s own volatility — a jumpy asset gets a smaller dollar allocation for the same risk contribution; a calm one gets more.
multiplied by total equity to turn the ratio into a dollar amount.
multiplied by
signal_strength— a stronger conviction signal gets a bigger bet, scaled proportionally.
so the two guiding moving variables are the asset’s own volatility and signal strength.
let’s take a look at how “bouncy” the average signal is on any given day. so how much is the average signal per day and how much does it change.
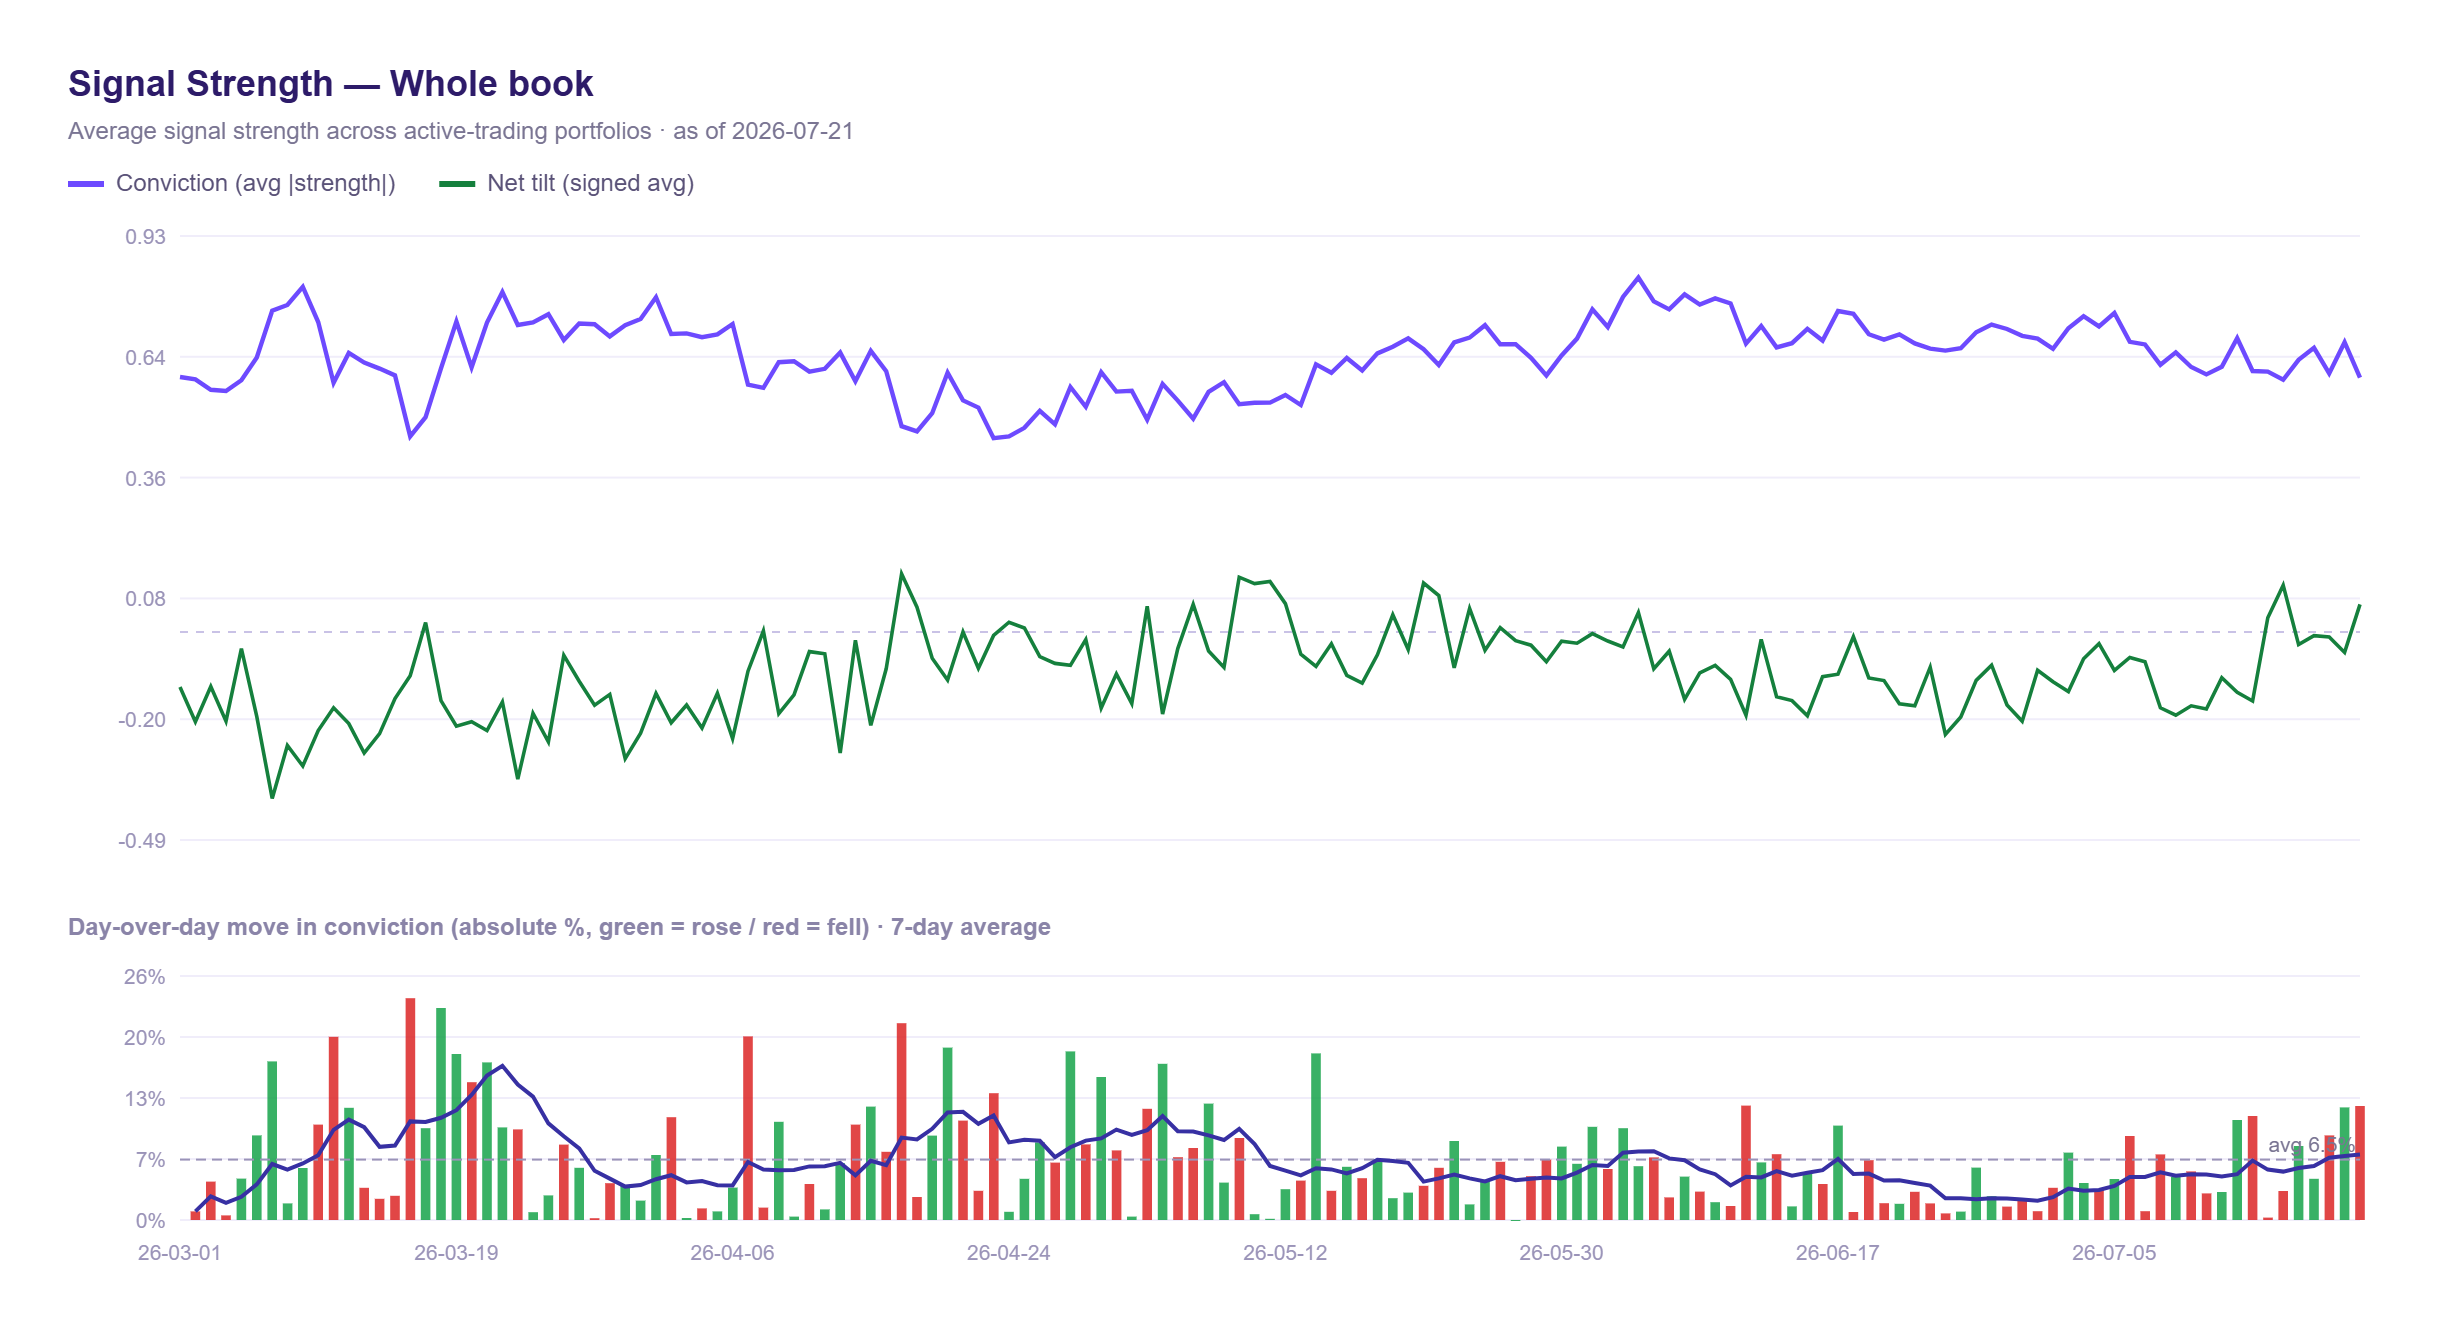
we can see that it is pretty bouncy, changing about 6% every day. let’s add a new plot and measure how correlated this is to turnover. I think that’s an interesting view here.
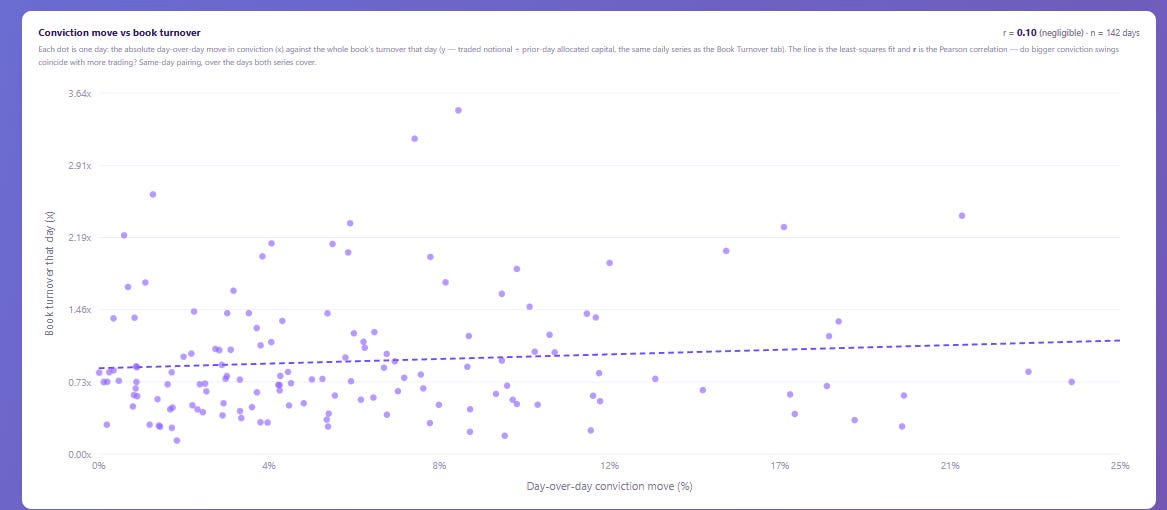
what’s interesting is that it doesn’t have a large relationship with turnover, which is quite interesting. before we make any kind of assumptions, let’s look at the next variable.
now we’re going to look at our forecast of volatility. if that’s too jumpy too, it can make our positions jump around more often than needed. this one is more tricky because the short-term nature of crypto, makes it more favorable to shorter windows, and that might be a driving factor of our turnover.
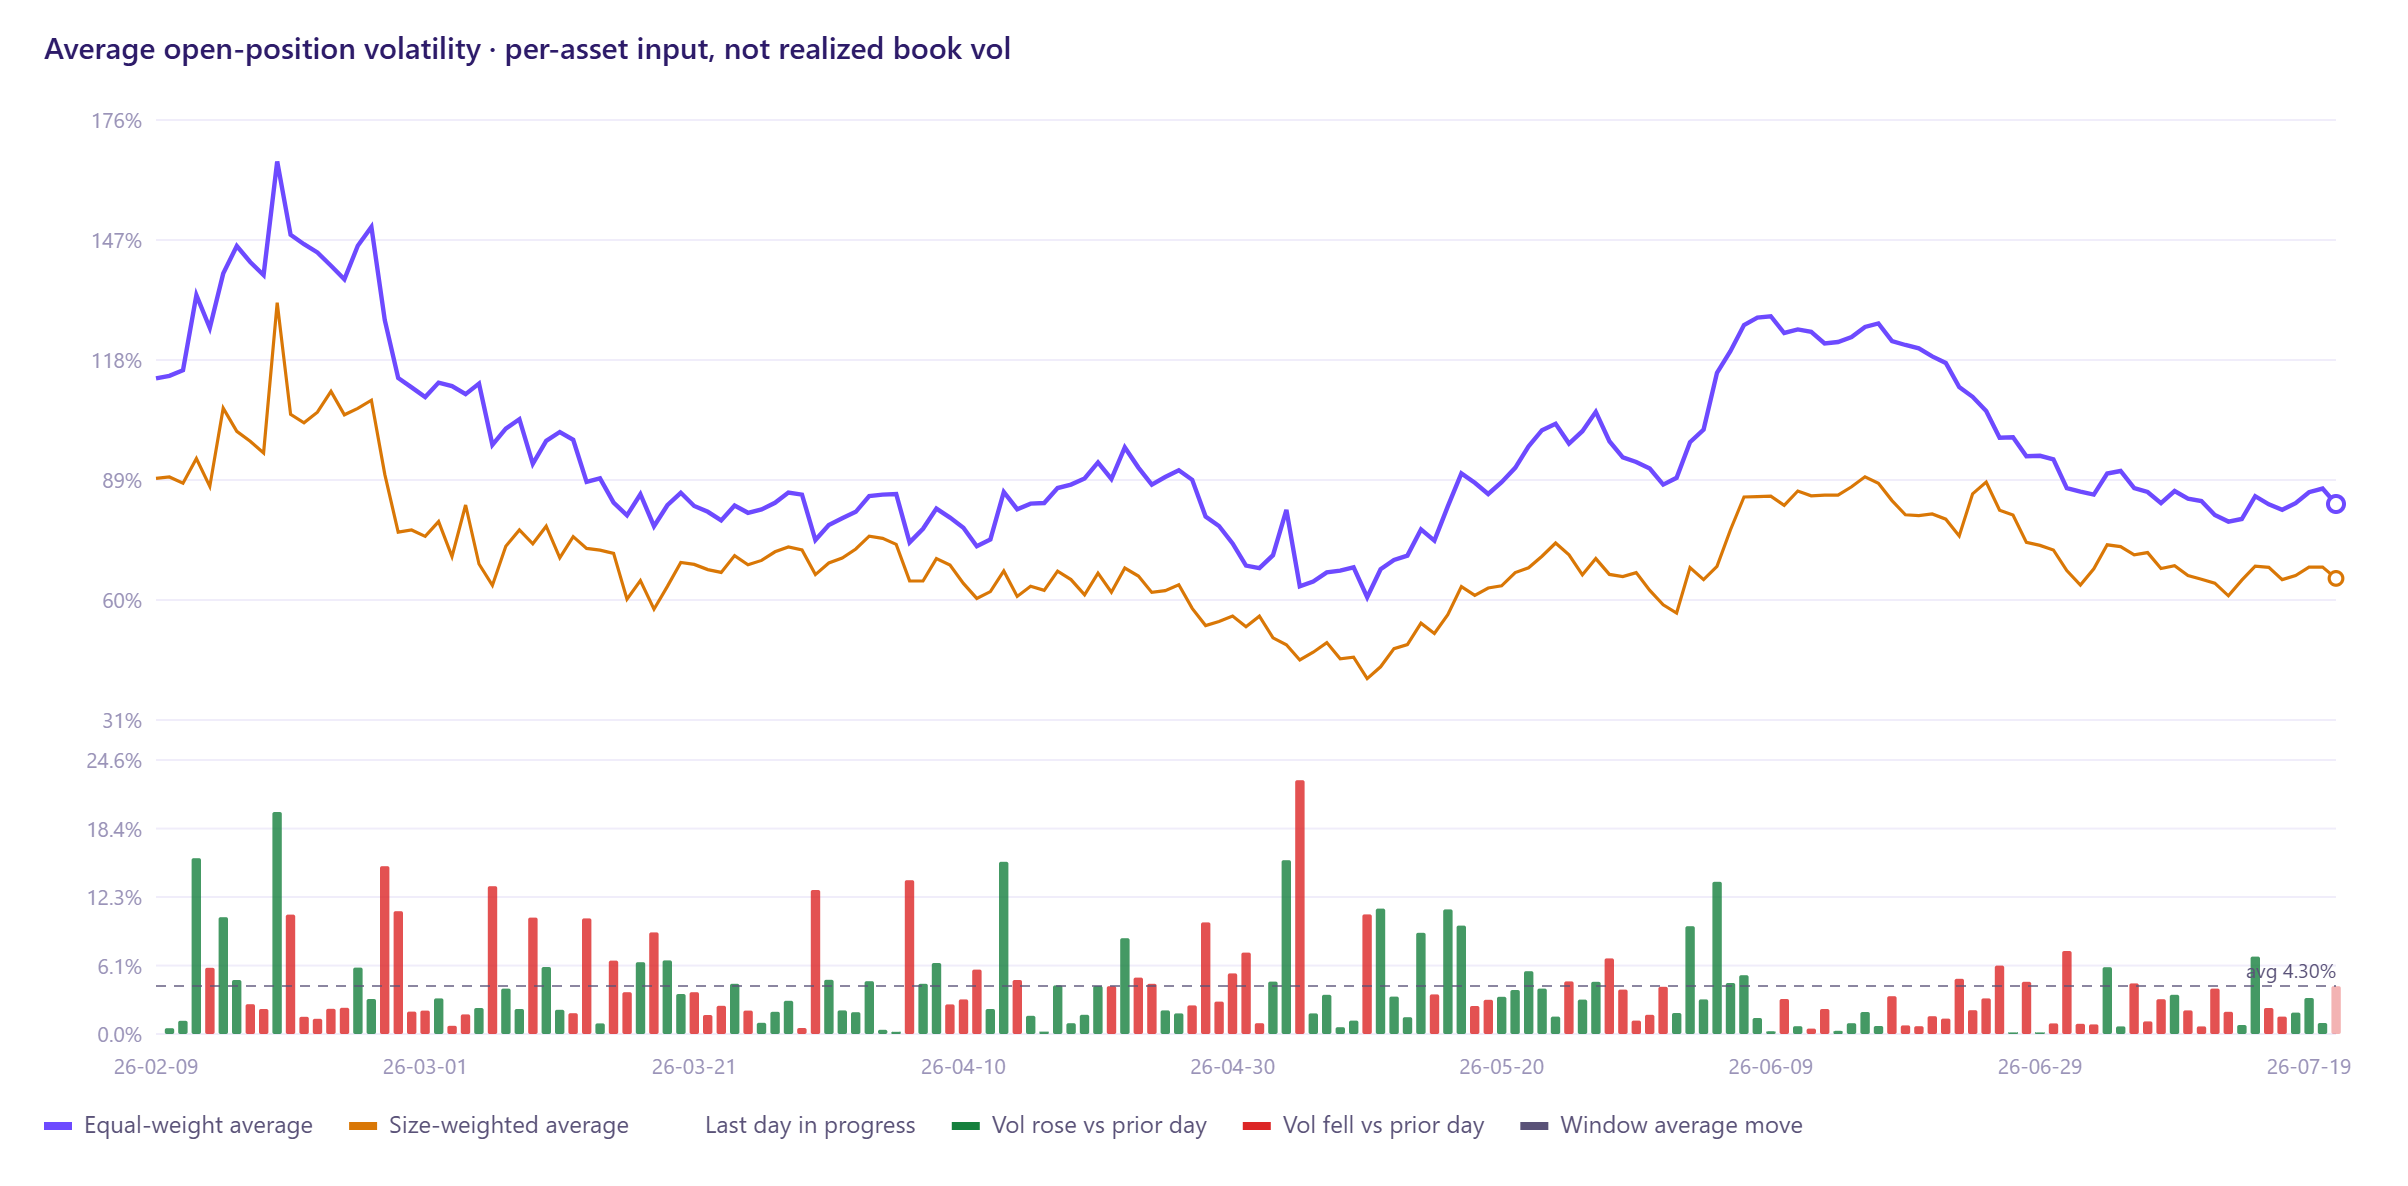
let’s also add here the correlation of a difference in volatility forecast from prior’s day to turnover.
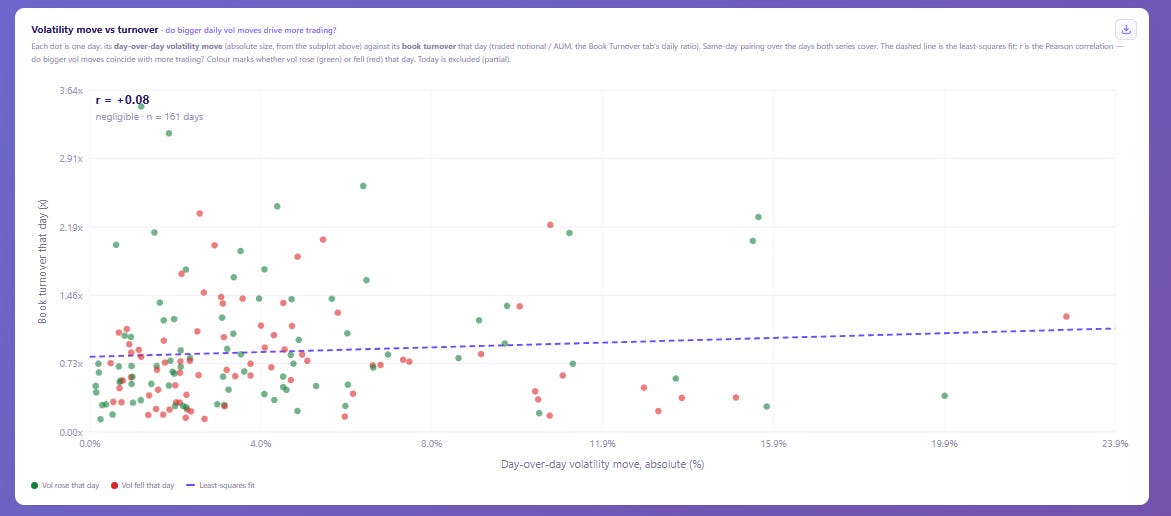
once again, the relationship is quite weak.
this leaves me questioning what then is really driving the turnover nob up. My next guess is probably the churn in positions, perhaps the portfolio is changing positions far too fast. Let’s check that. For this I’ve classified all the orders over the last few months into 4 categories:
entry
exit
rebalance
reversal
the idea is to figure out which of these is generating the most amount of volume.
and as I suspected, entry and exiting of positions is doing all the “damage” here.
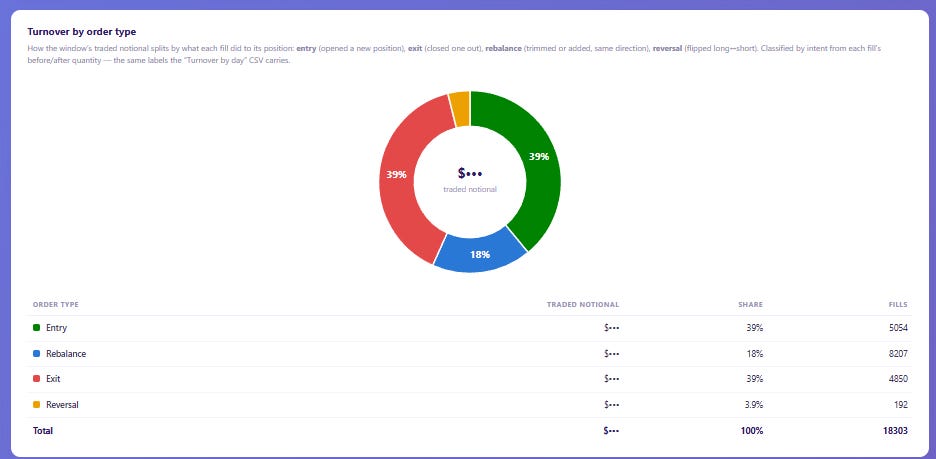
about 80% of all the volume comes from these two categories alone. This is also a pretty sticky thing over time.
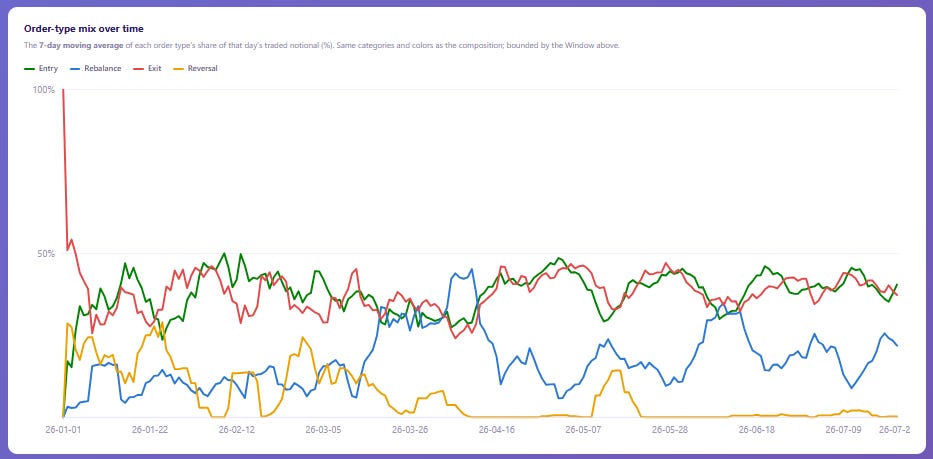
any trading action, in general, must be economically a net positive right? the value we expect to get from it on average, must outweigh the cost of that action, otherwise just hold that position and extract the remaining juice that's there to extract.
the question now is: Do I really have this much edge to be churning positions this much?
my intuition tells me that probably not and we need to look into it.
we have to breakdown the problem from a first principles approach.
what are we trying to do?
reduce the amount of times we churn positions.
ok, why would we exit a position and enter another?
because we believe that the position we exited no longer gives us the same expected return after costs, as the new one we just entered.
great, can you mathematically prove that? do we have a way to check, before we trade, what’s the expected return of this trade, compare it to the current trade we’re trying to replace it with, and then go from there? no!
i asked fable to build me a dashboard I could easily visualize the churning of my positions by date.
not too bad, better than reading rows in excel.
few things I see:
a) older models (4) churn much more aggressively than new models (7). this makes sense because I did some work to reduce churn in the latest models.
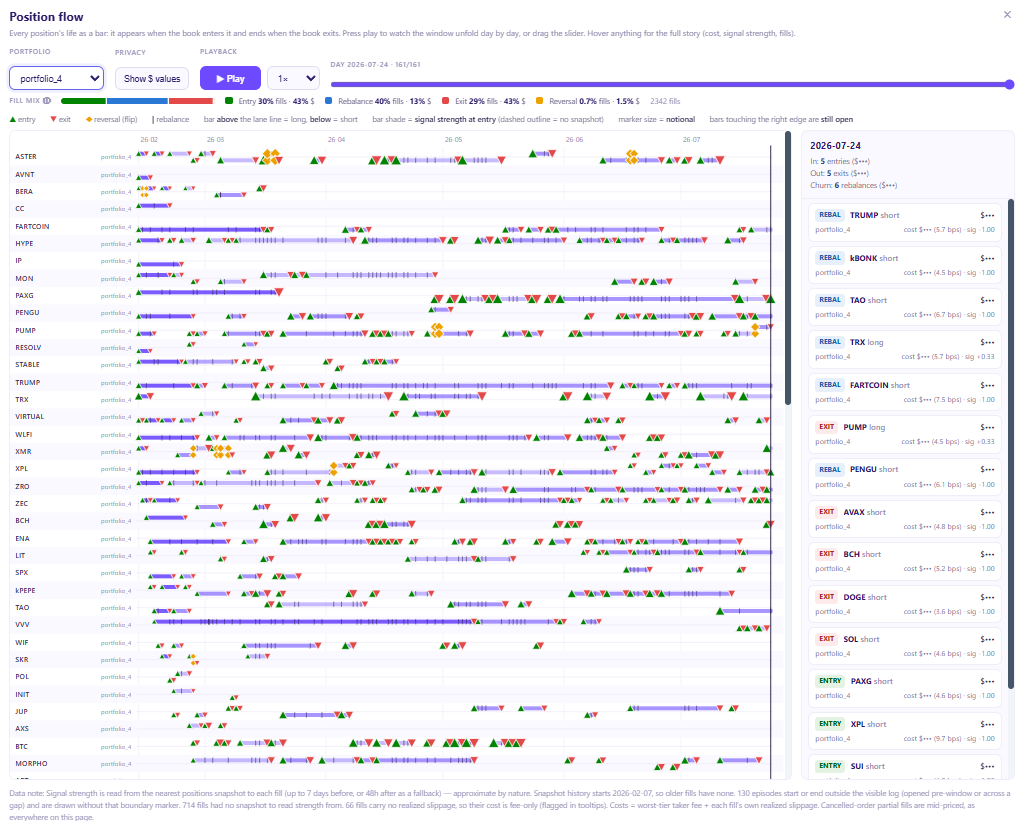
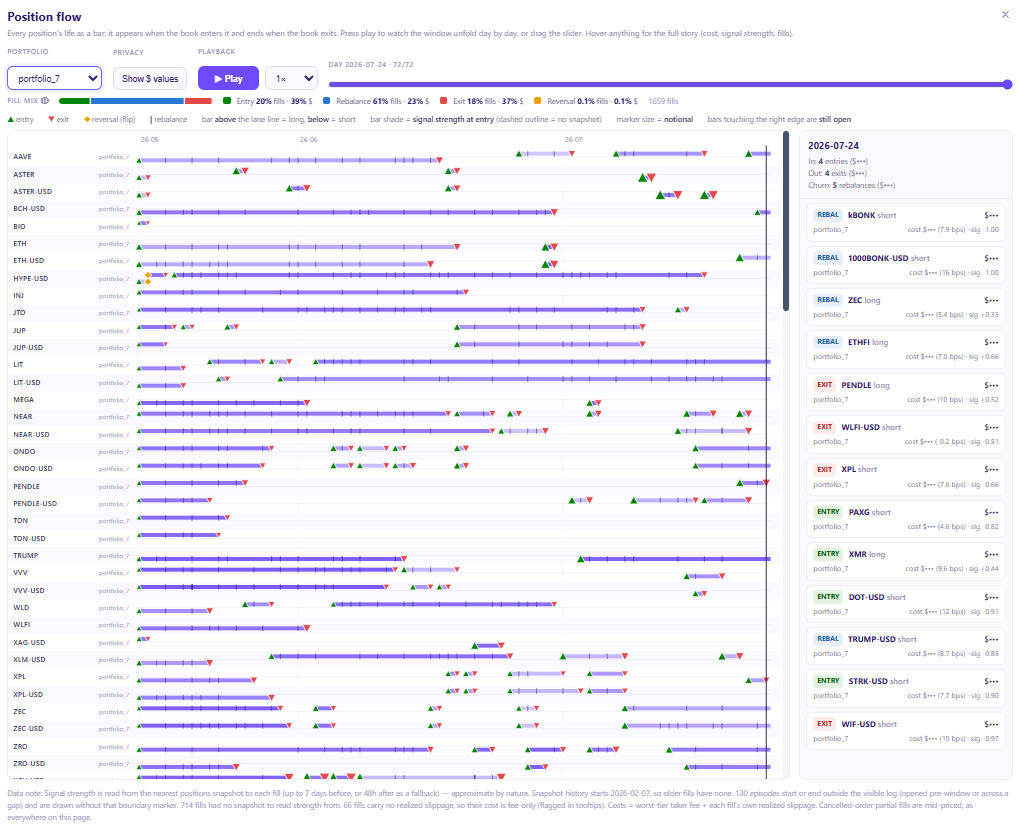
b) some positions are legitimately held very short-term, only a few days, need to figure out why this is. I have an idea why, but I cant say for sure.
c) the amount of fills are the vast majority on rebalances. but the vast majority of $ by fill type is on entry/exit, what we discussed prior. this makes sense because rebalances are usually smaller into a target, as opposed to entry and exit which churns the entire position.
now my next idea is, what is the total cost of churning the positions by holding time?

ok so in terms of holding periods, the majority of my costs (58%) are coming from positions held within the 0-3 days period.
and about 82% of all costs from 0-7 days holding period.
now the work is understanding what can be done about those fast churns.
there’s already a decent amount of cash I can save if I can reduce that a tad more.
my first test will be changing the max positions I can have open into deciles or something of the sort. I now pick a set number (20) of positions that the portfolio can hold at any given time, within a variable universe by some constraints.
however my guess is that 20 positions is too low, and i shouldnt be constraining it like that. having a too constrained amount of positions, means that there’s a significant chance that every day, in the hundreds of assets available, that something is stronger/weaker than the current pool, having to churn whatever’s there.
then the next idea is to really dig into the signal itself and quantify the forecast better.
up until this point I have quantified signals simply by how strong/weak the signal is, normalize it, and that is what is used to size the chosen positions.
but I might do better by adding OR replacing that layer with a forecast post costs. so if my forecast tells me on average this new positions pays me 10bps or whatever, but it costs me 15bps to take it, than no matter how strong that position is, probably I shouldnt be churning for it.
that is where I think I’ll save most cost.
so i’ve just went on and tested our first hypothesis—increasing the total number of positions we hold… and that didn’t work in terms of reducing costs. it moved it down a bit, but nothing relevant.
what we’re going to do next is evaluate the decision of churning a position.
that will take some work but i do think it’s where the problem lies.
if once again we don’t make much progress then, i will have to think about it, but i dont wanna get stuck here too much either as there’s other things to do.
so this is the backtested distribution of trading costs of the old model. it pretty much aligns with our live results of the vast majority of execution costs come from entering and exiting of positions.
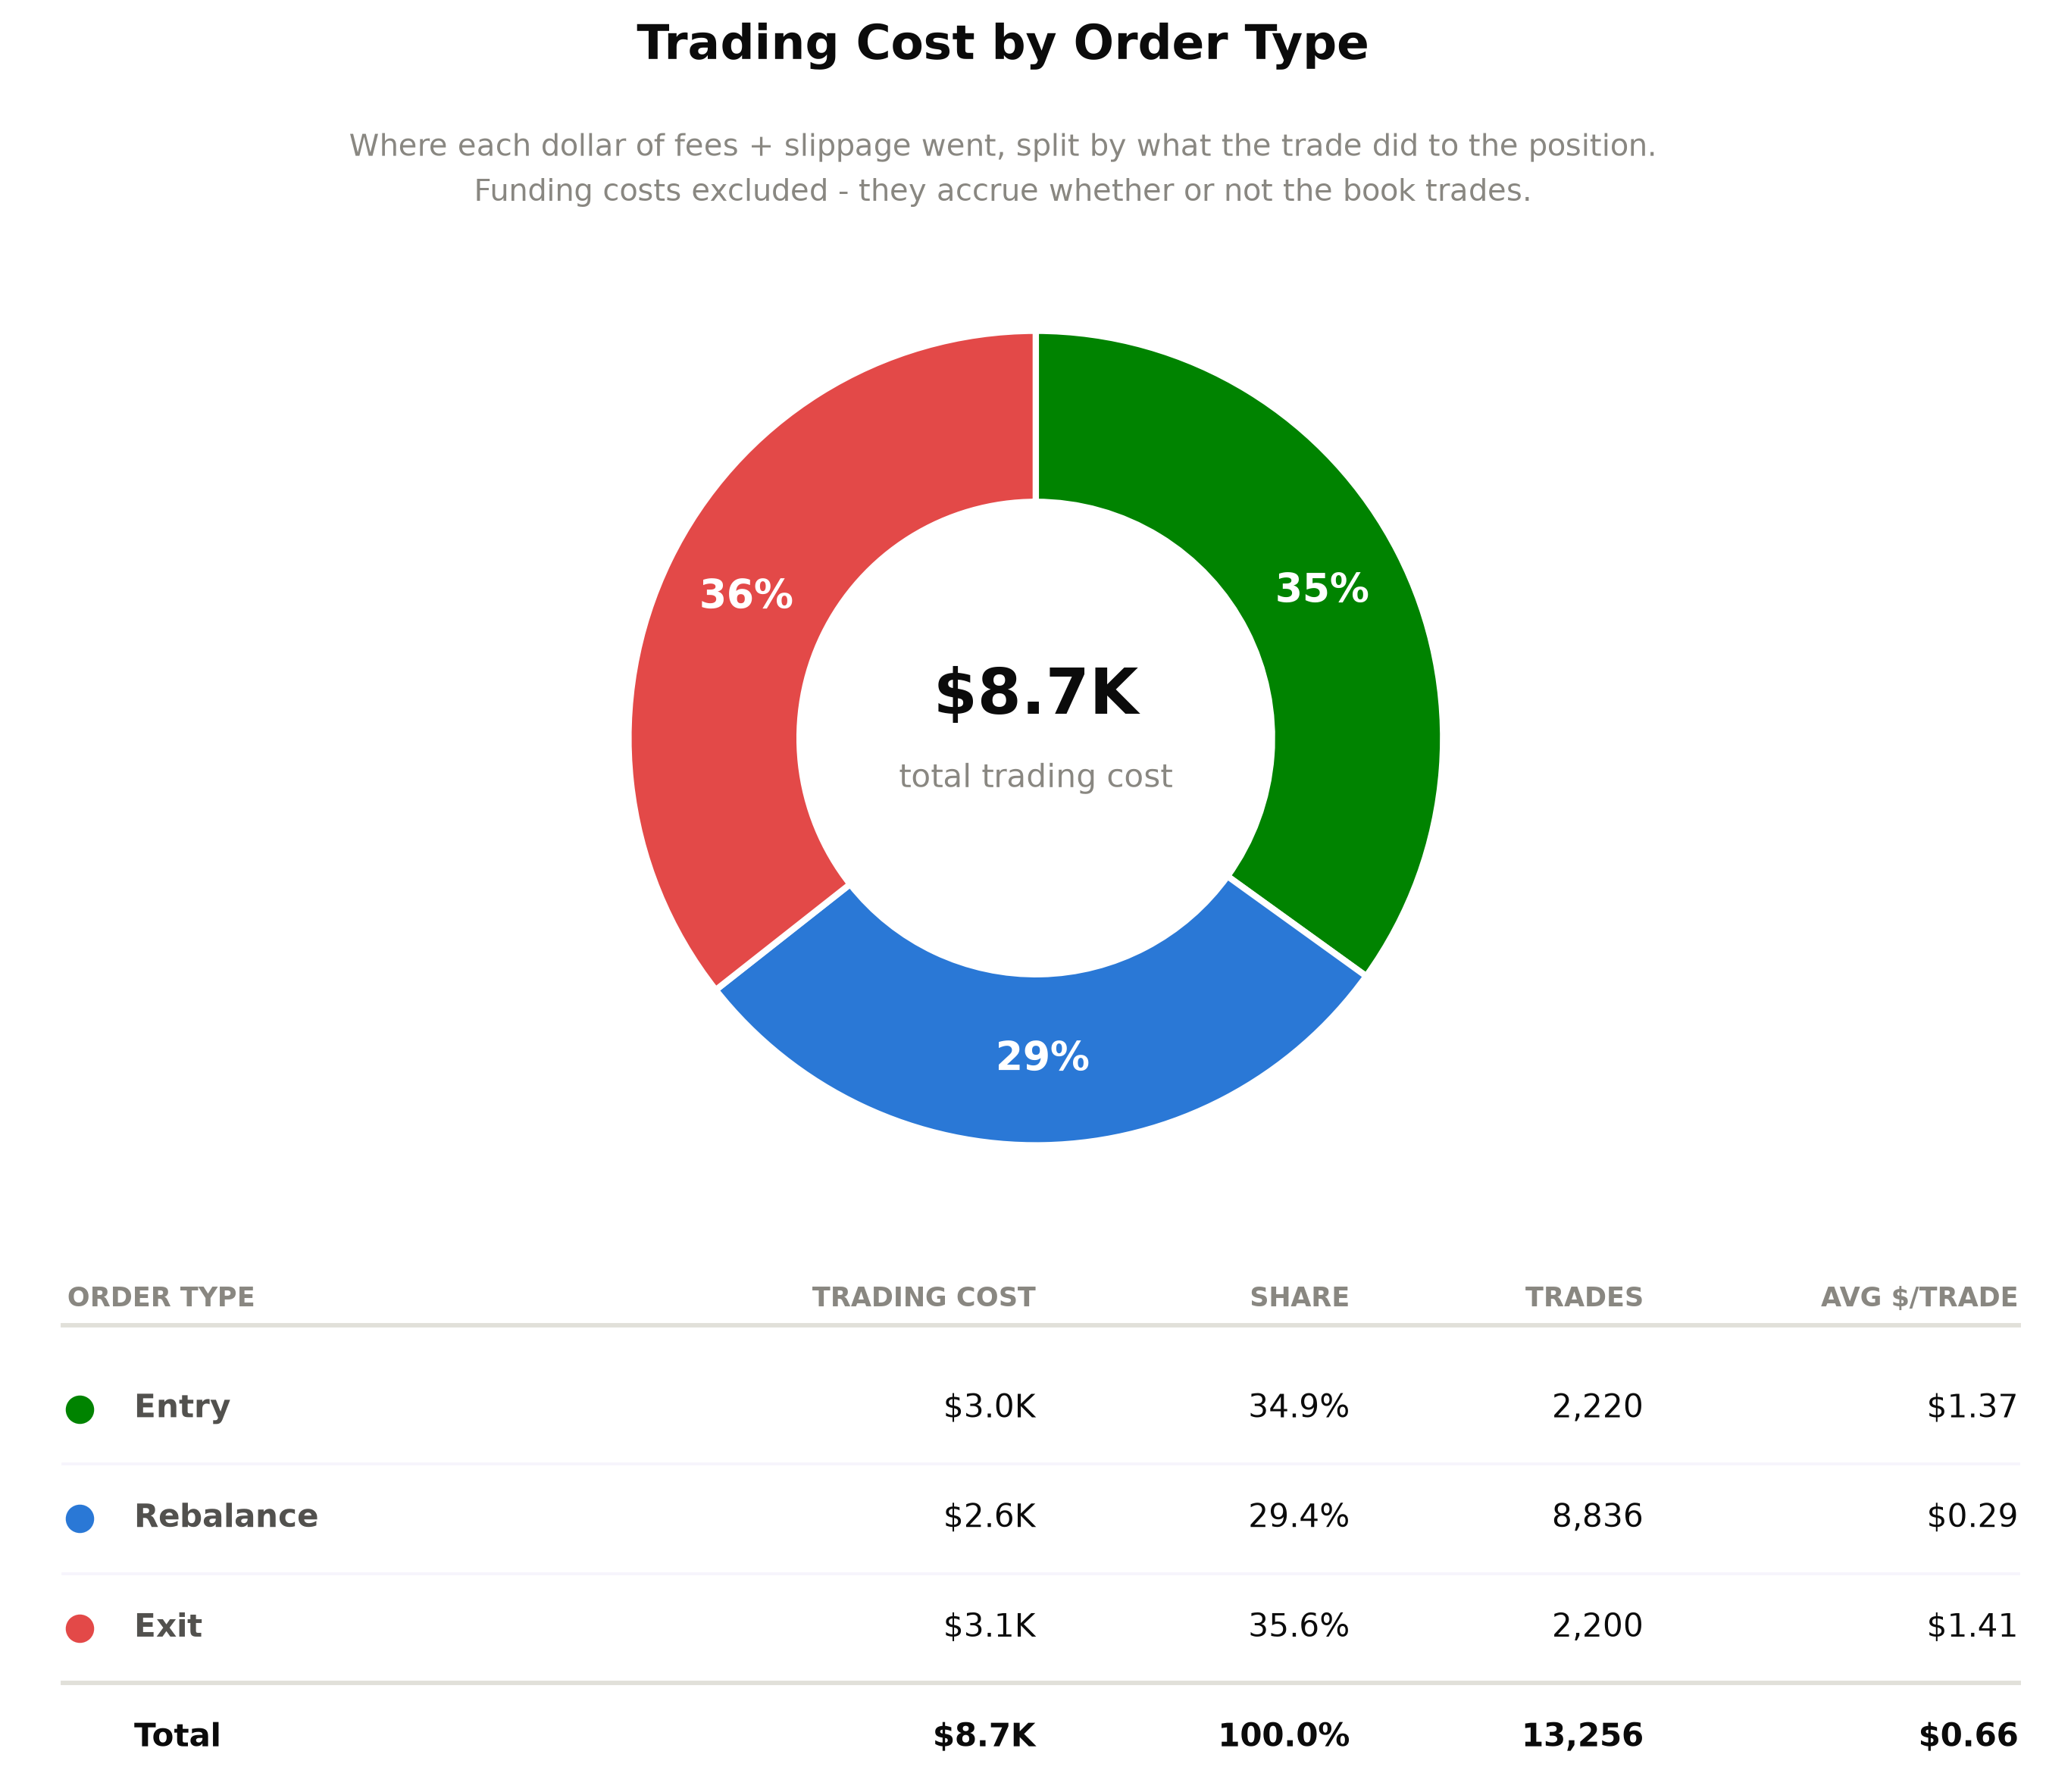
now i went ahead and added a simple rule that forces the new signal that is about to replace the incumbent, to be at least 50% stronger than it.
what i found is that yes, it does decrease the costs, but not that significantly. the cost of entry/exit orders goes from 71% to 62% of the total cost.
progress, but the damages to PnL is far greater than whatever we save here.
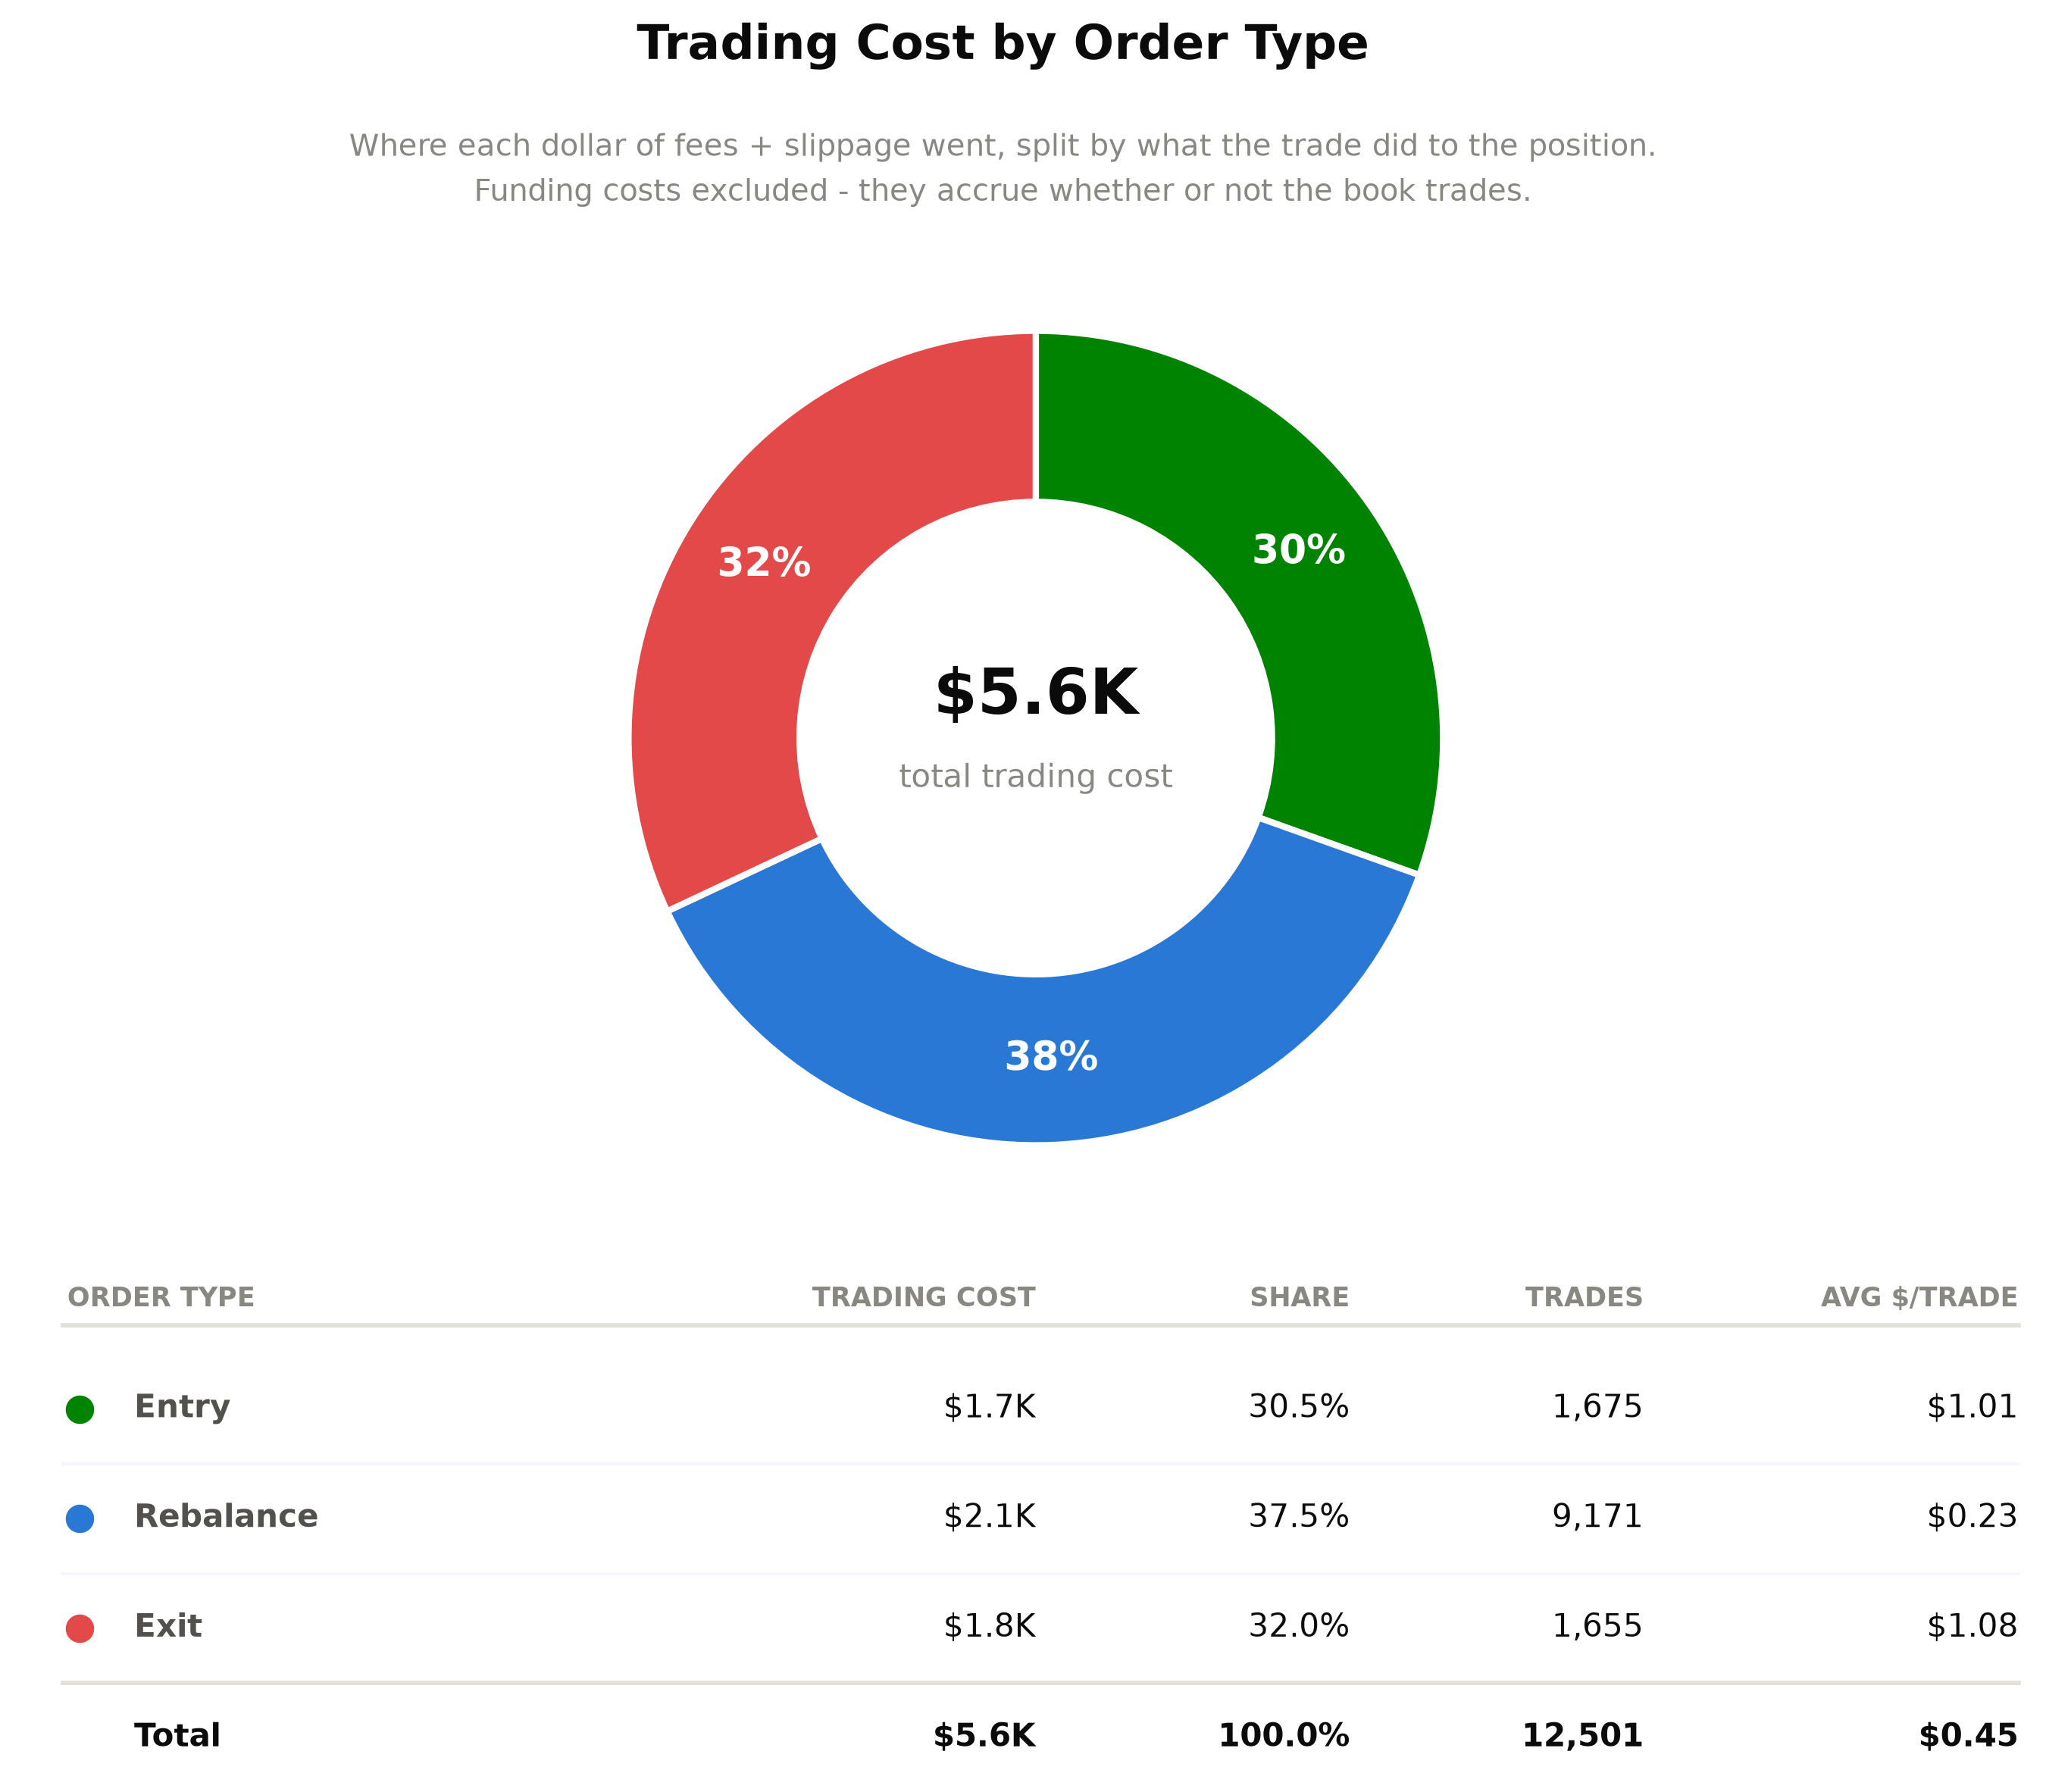
it tells me that there’s legitimate information in those signals, and that we are throwing it away by adding too large of a barrier it must jump, before it replaces older positions by stronger new ones.
i am going to try something super simple and add a final smoother at the output signal we get, and then think backwards from that. the signal may be too jumpy now.
this is the “jumpiness” of the signals on the old model.
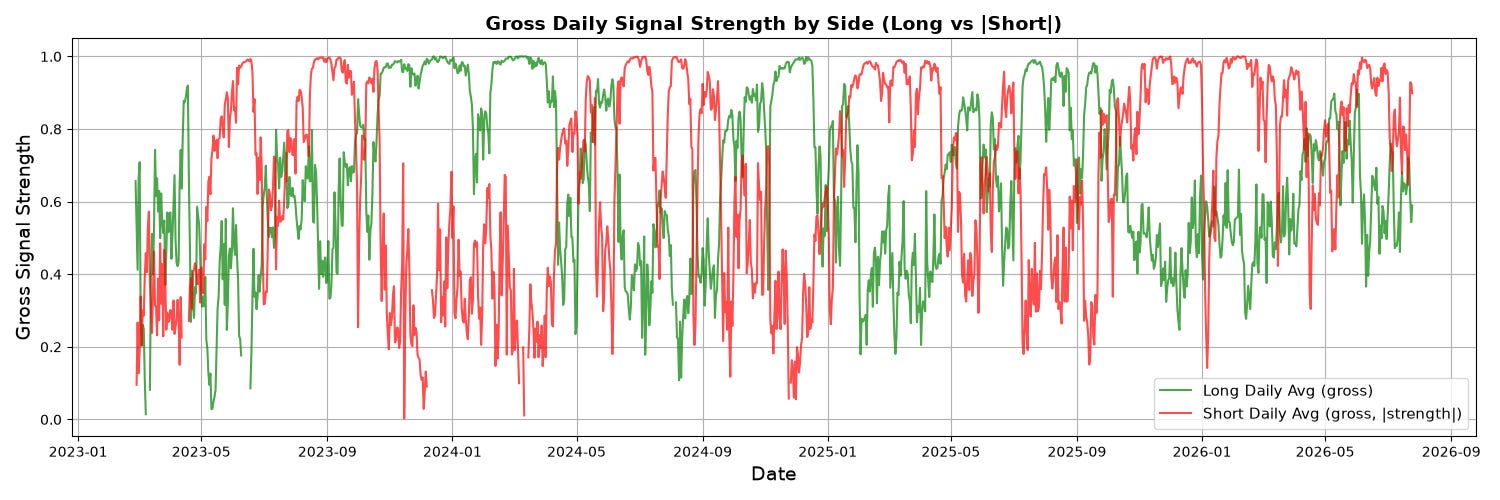
and this is the jumpiness of the signal if we layer that smoothing factor on top/
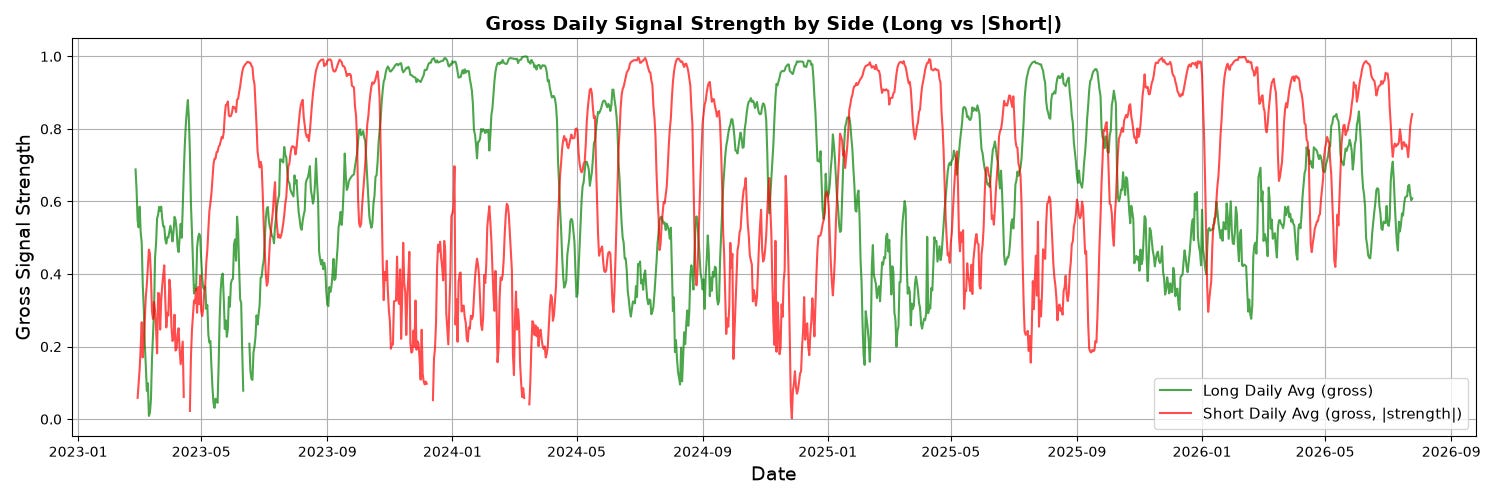
don’t even nerdy maths to see the difference ey.
and voila.
the costs do go down a ton. from $8.7k to $4.2k , which is a 52% reduction in total cost.
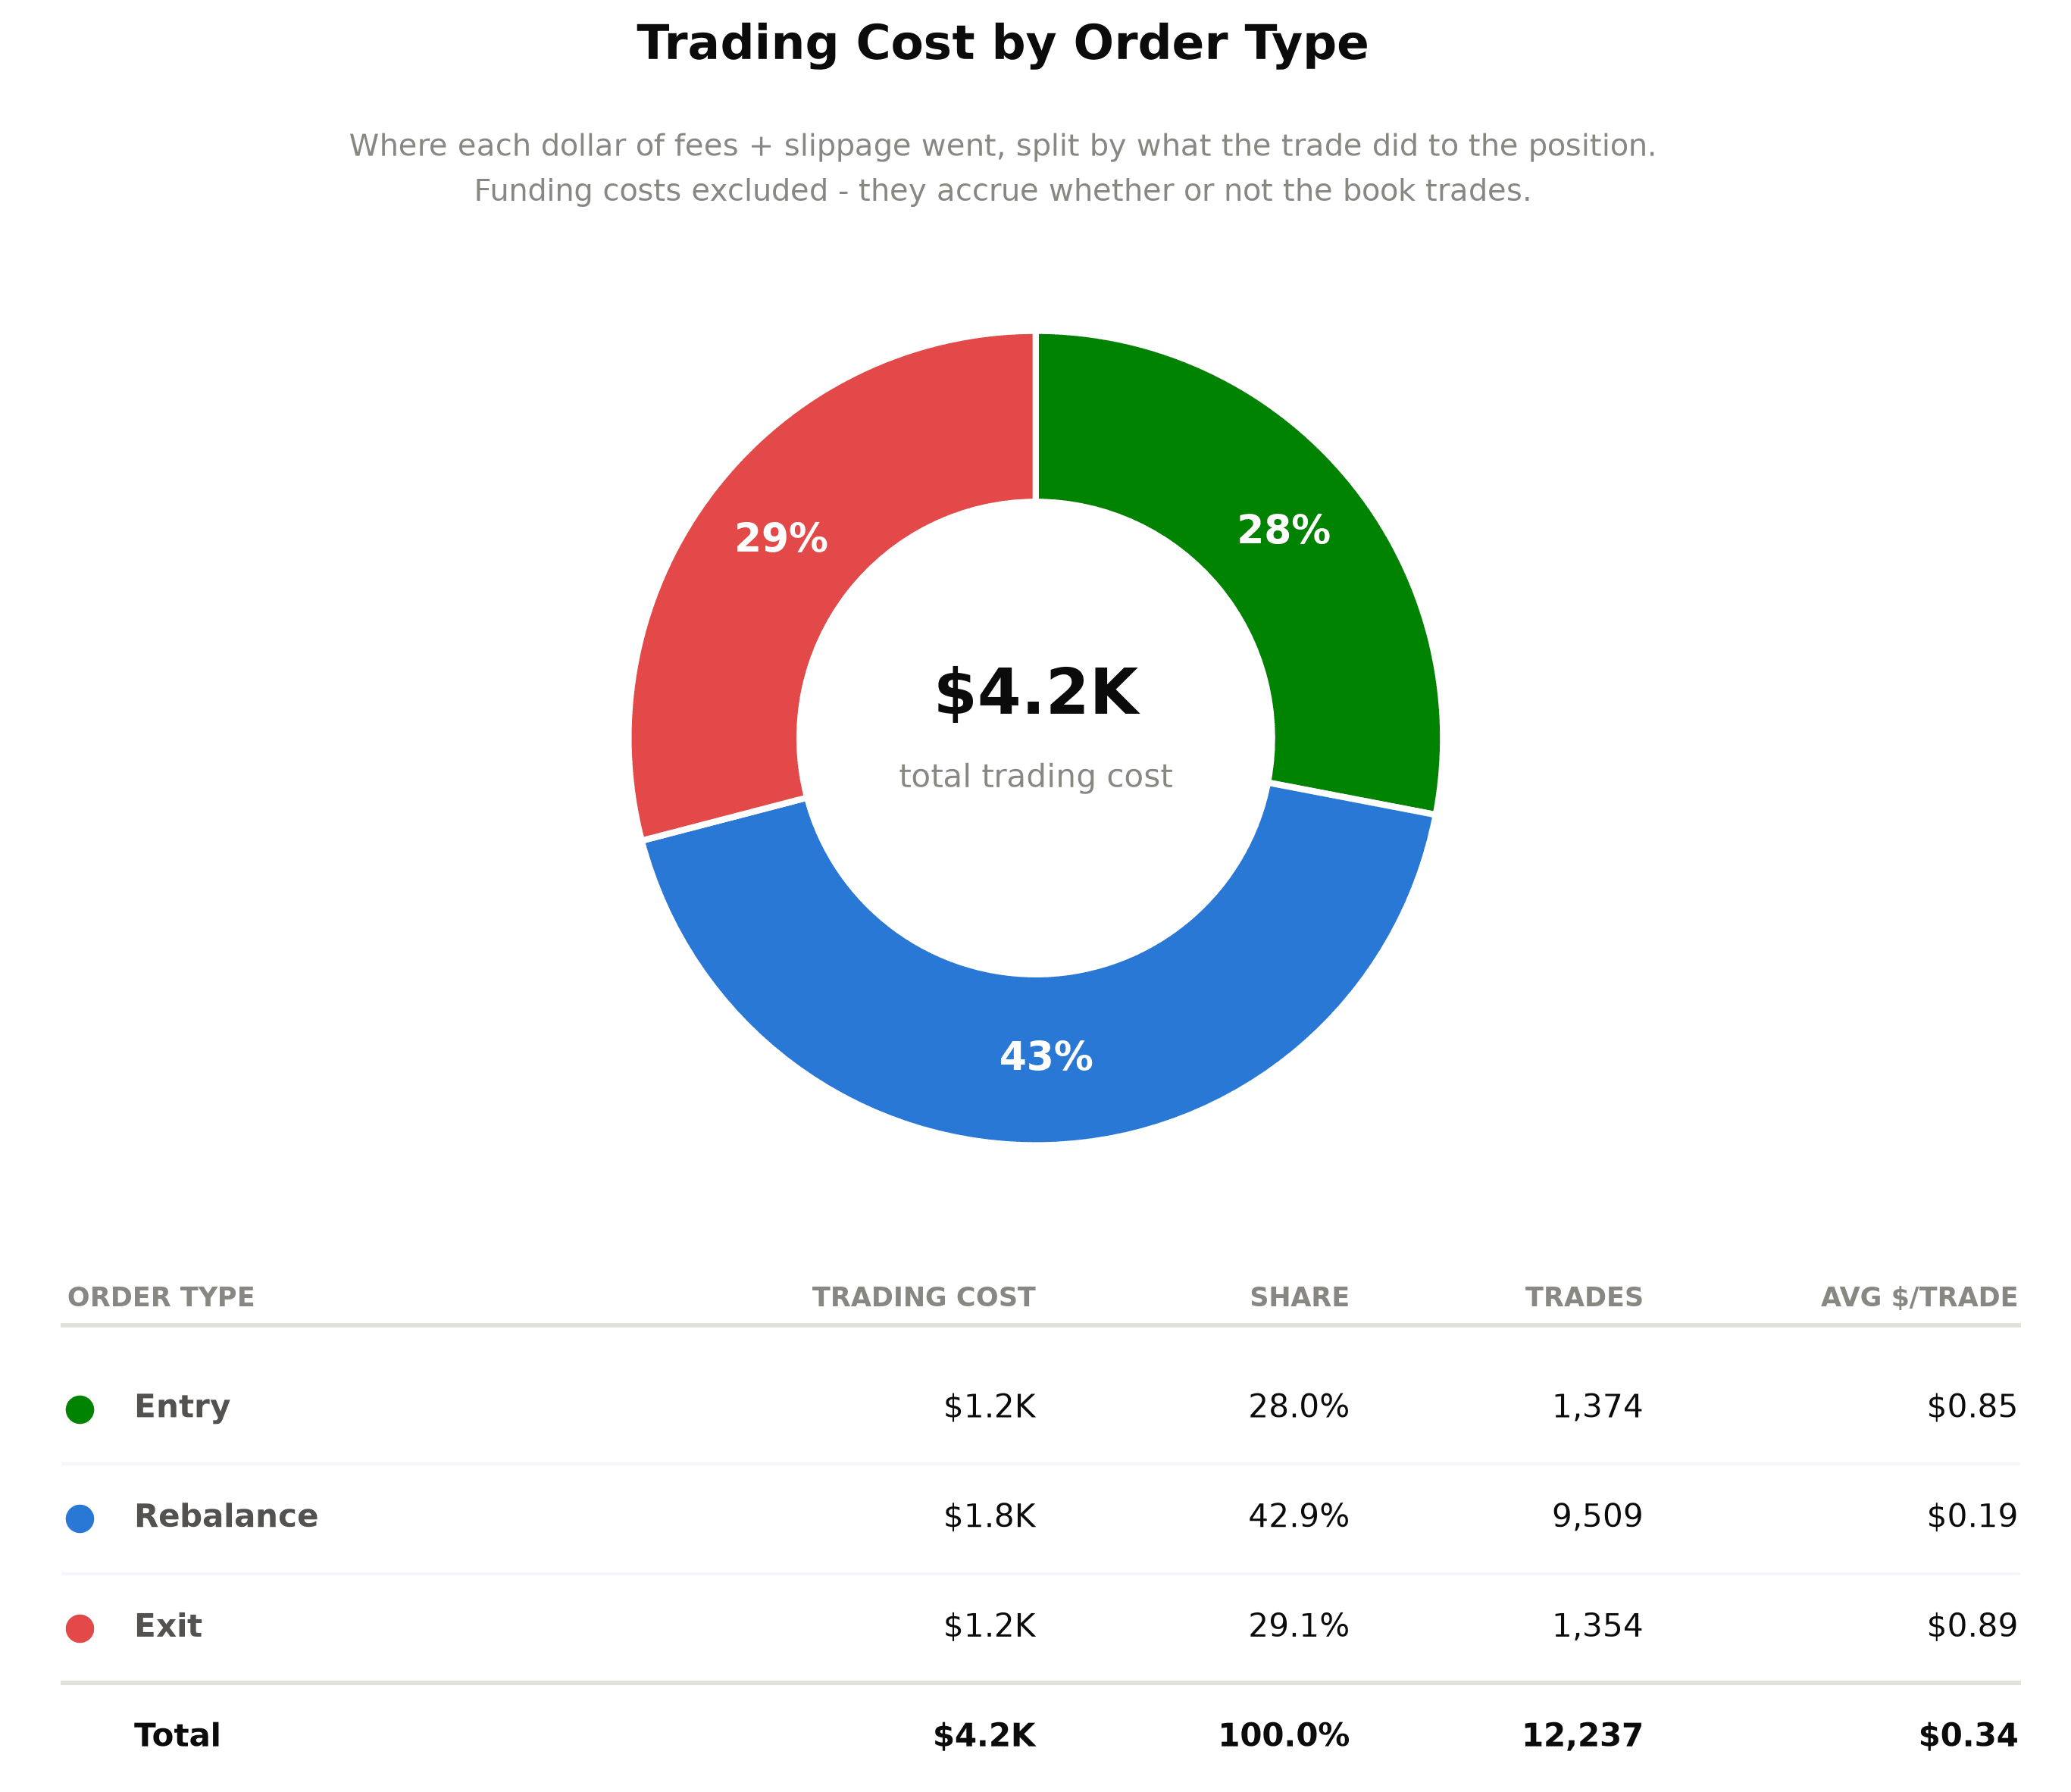
now the final question is, how much did it cost us in PnL?
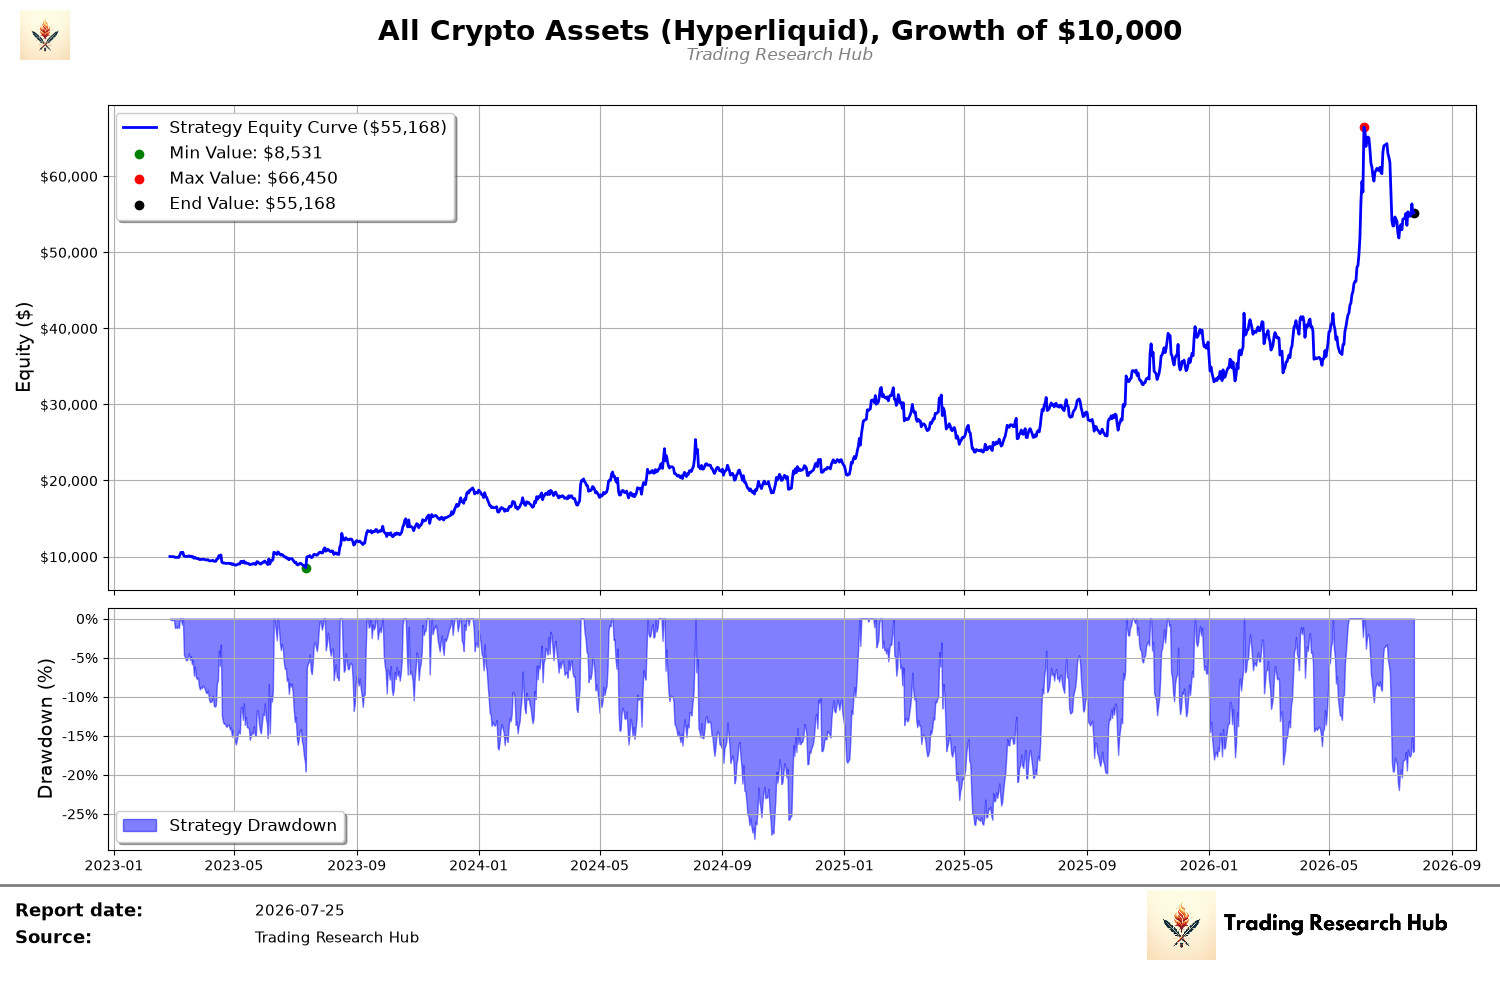
well, here’s the old backtest performance.
and here’s the new model with that smoothing layer on top of the signal.
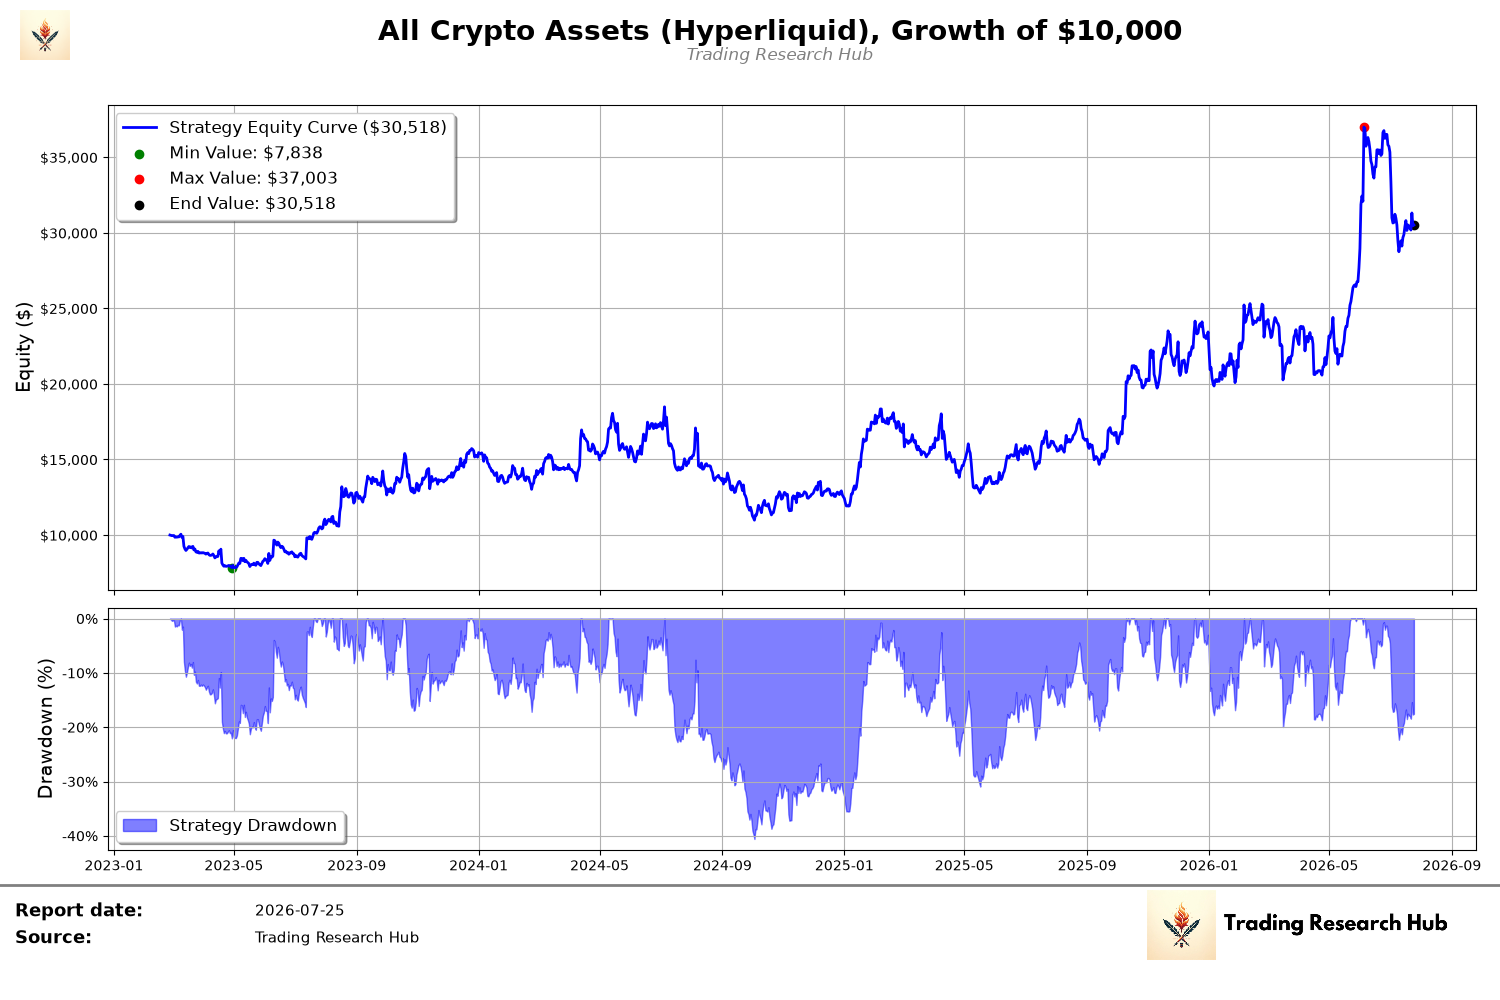
it does seem to lose some performance, at least historically. not even with the savings it makes up for the lost performance.
does this means that it is worthless?
no!
we’ve identified the source of the problem which is the jumpiness of the signals.
the next question is, how do we solve for that without losing too much information that we get from that “jumpy” signal.
a question for a next post.
Disclaimer: The content and information provided by the Trading Research Hub, including all other materials, are for educational and informational purposes only and should not be considered financial advice or a recommendation to buy or sell any type of security or investment. Always conduct your own research and consult with a licensed financial professional before making any investment decisions. Trading and investing can involve significant risk of loss, and you should understand these risks before making any financial decisions.