
I Wasted Months Sizing Positions Wrong. Here's What Actually Worked.
The correlation fix that doubled my portfolio's volatility (on purpose)

👋 Hey there, Pedma here! Welcome to the 🔒 exclusive subscriber edition 🔒 of Trading Research Hub’s Newsletter. Each week, I release a new research article with a trading strategy, its code, and much more.
If you’re not a subscriber, here’s what you missed this past month so far:


If you’re not yet a part of our community, subscribe to stay updated with these more of these posts, and to access all our content.
Hey friends,
The other day I figured out that my crude volatility targeting formula was, well, too crude. That meant that a lot of times I wasn’t hitting the volatility target I set for the portfolio.
Why is this even relevant? Well, I was capping the portfolio too much compared to the risk I was willing to take. I thought that my portfolio would “wiggle” by a certain amount, but it only did by half of what I targeted. By the end of today’s article, we’ll fix it. The historical equity curve jump looks like this:
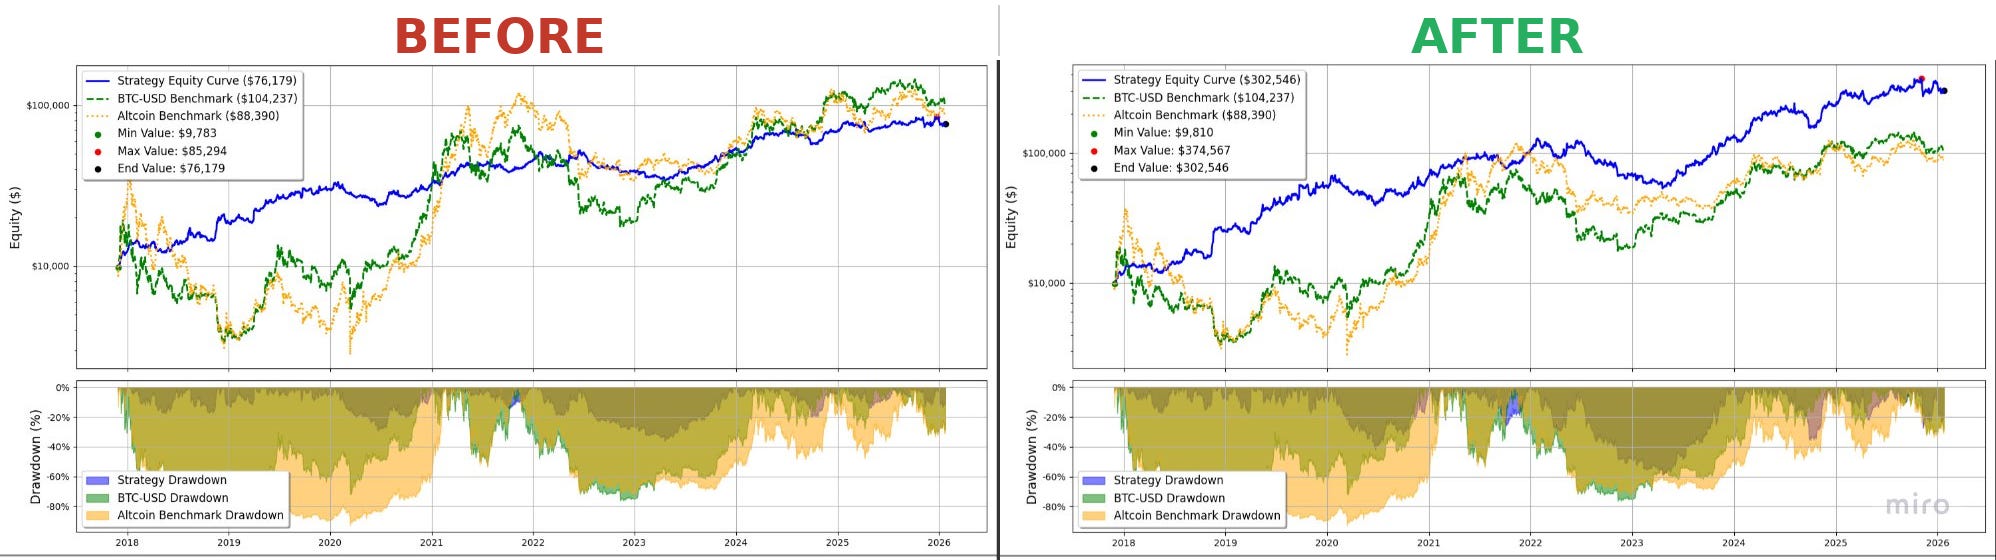
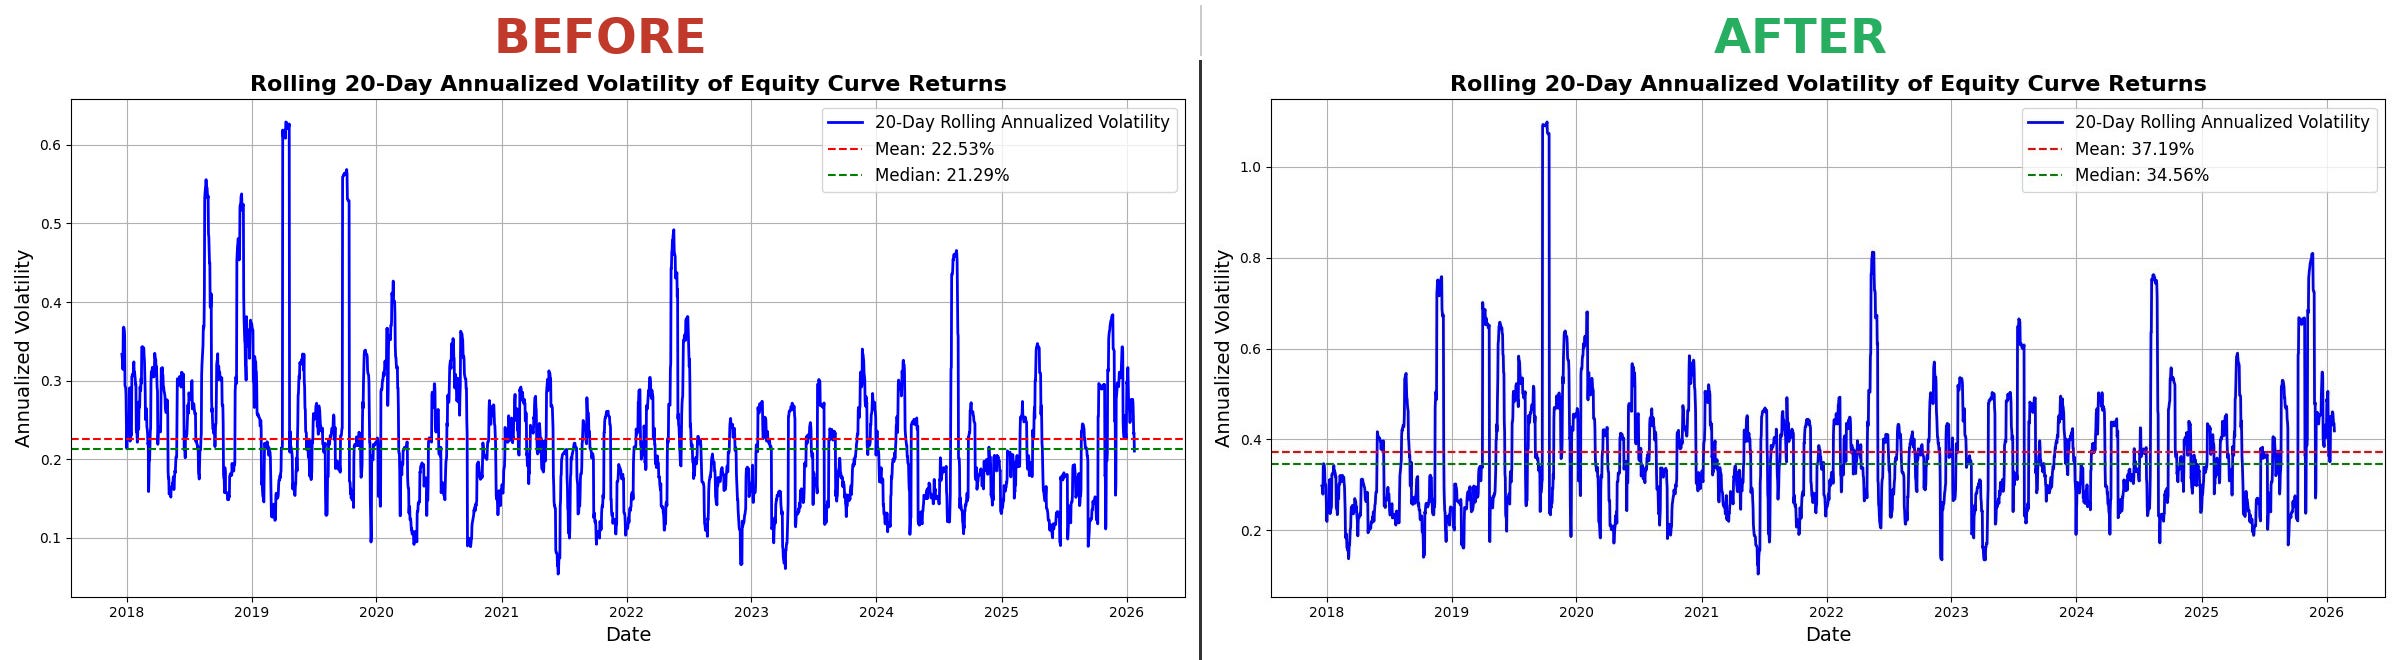
The volatility will also go from half (20%) to the target of 40% as we intended:
We explored the debugging that led me to this conclusion, in more detail in the previous article, when we figured it was due to the underlying assumption that all positions were correlated with each other.
Today we’re going to get deep into the nitty gritty of correlations the math formulas and the solution for now, to this issue.
Don’t worry, I’m not going to make it math heavy like some of the quant substacks like to overcomplicate. I am not a quant, I’m just a trader using simple, robust solutions to my systematic trading. I’m going to keep it as simple as possible, because that’s what fits me. I’m not great at math. I can understand basic concepts, so I have to keep it basic.
Personally, the most important thing is understanding. I need to understand what I’m doing on the backend, otherwise I can’t do it. I think that’s a concept I share with you a lot of time on this blog.
Let’s get into it.
The Setup: Why Equal-Weight Sizing Needs Volatility Adjustment
Let’s start at the very beginning.
Imagine that you have multiple positions. You want to size them equally because, well, you don’t want a single position to contribute disproportionally to the portfolio right? Holding a SHIB position is way different than holding a BTC position in terms of volatility. One wiggles around way more than the other.
We’d already fixed for this with our crude formula that was getting us half the target. We’d take our target volatility, divide it by the positions we wanted to hold for that day (max_signals_for_day), and divide it by the annualized volatility of the asset.
The size magnitude becomes inverse to our estimate of future volatility. This means that an asset with higher expected volatility gets a smaller position, and an asset with lower expected volatility gets a larger position.
volatility_targeted_size = (target_volatility / max_signals_for_day) / annualized_volatility_20 * total_equityNow, like I said above, we weren’t factoring in correlation of the individual positions. So if we had a book that’s long/short, market neutral, well half the book PnL is uncorrelated to the other half, right? So there’s a bit of an issue there.
First let’s talk a little bit about correlation and what it really means.
Part 1: What Correlation Really Means
Correlation is just a way to measure something like “when asset A moves, does asset B move with it?”
Think of it as a score between -1 and 1:
-1          0          +1
 |          |           |
 ↓          ↓           ↓
A up,      A tells     A up,
B down     you         B up
(always)   nothing     (always)
           about B
The formula for the correlation of two return series X and Y is:
ρ(X,Y) = Cov(X,Y) / (σ_X × σ_Y)Where the covariance measures how X and Y move together:
Cov(X,Y) = Average of [(X_i - mean_X) × (Y_i - mean_Y)]
Let’s make it practical. Say we have 7 days of returns for BTC and ETH:
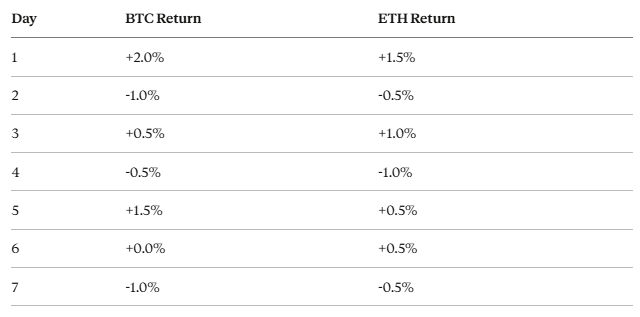
Step 1: Calculate the means
mean_BTC = (2.0 - 1.0 + 0.5 - 0.5 + 1.5 + 0.0 - 1.0) / 7 = 0.21%
mean_ETH = (1.5 - 0.5 + 1.0 - 1.0 + 0.5 + 0.5 - 0.5) / 7 = 0.21%
The mean is simply the average return over the window, in this case 7 days.
Step 2: Calculate deviations from mean