
Testing a 2.41 Sharpe Trend Following Strategy — From Paper to Backtest
Do the paper's findings match reality?

👋 Hey there, Pedma here! Welcome to the 🔒 exclusive subscriber edition 🔒 of Trading Research Hub’s Newsletter. Each week, I release a new research article with a trading strategy, its code, and much more.
If you’re not a subscriber, here’s what you missed this past month so far:


If you’re not yet a part of our community, subscribe to stay updated with these more of these posts, and to access all our content.
Hey friends,
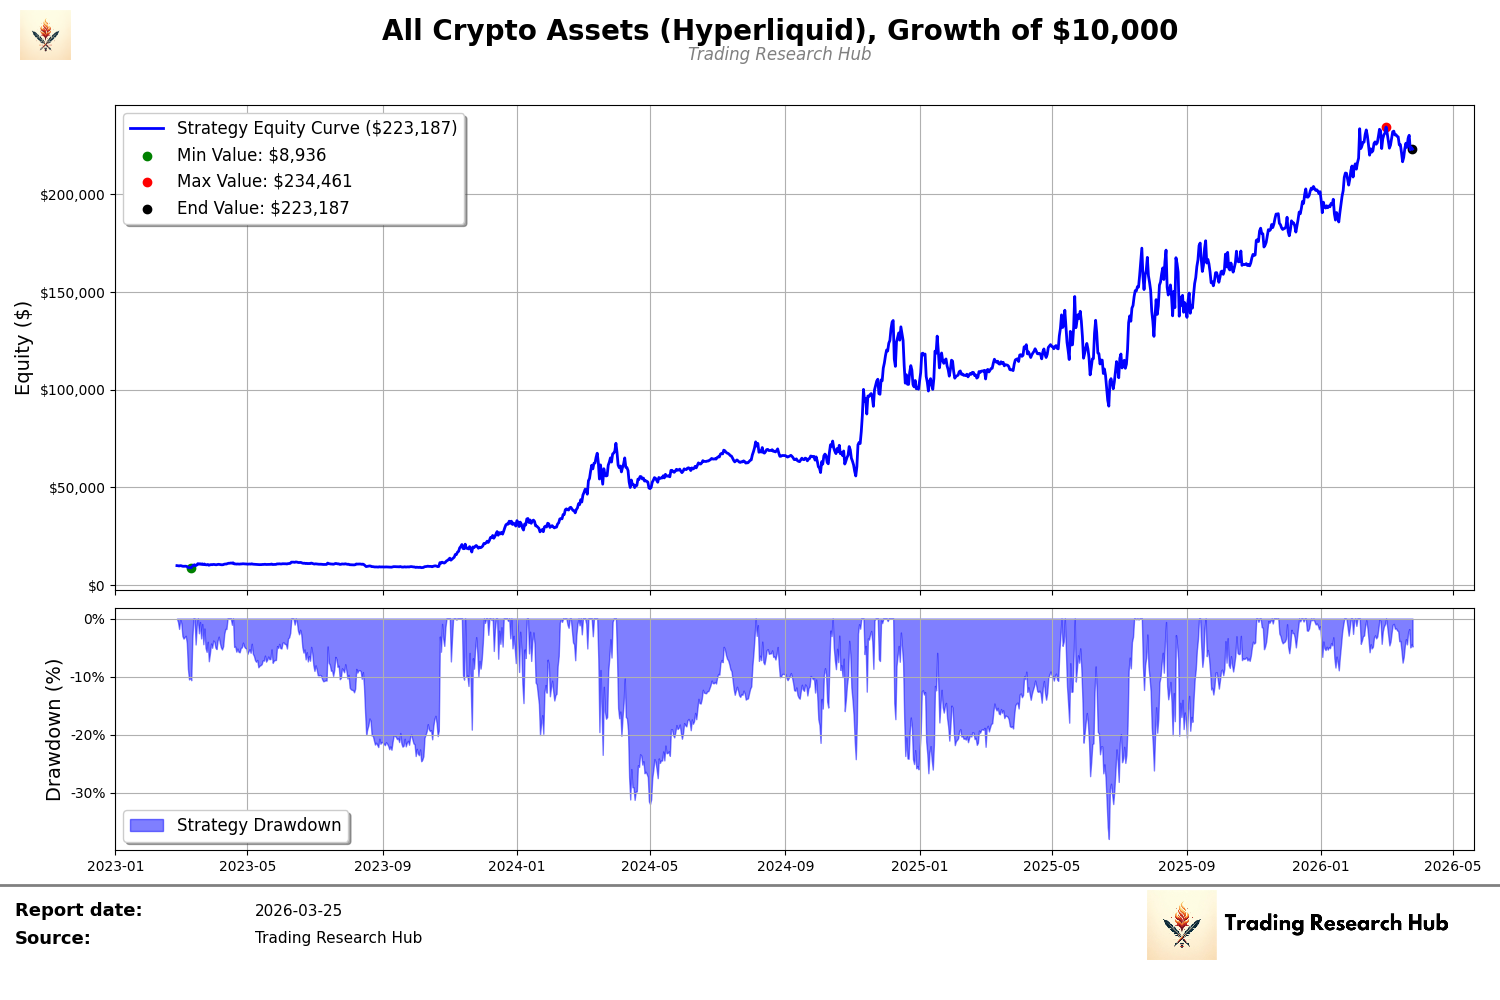
Today we’re testing a trading strategy I found in a paper where the author claims it produced a Sharpe ratio of 2.41. It’s a trend following strategy, so naturally I’m curious — how did they achieve a 2.41 Sharpe on trend following?

Over the past couple of weeks I’ve been heads down on a bunch of different things — new mean reversion models, infrastructure work, the usual. Those models are now running on their own, collecting data for me to analyze, so it’s a good time to go back and test new variations of what we already work with.
This one’s interesting because the paper adds complexity my systems can’t handle yet: intraday trading. My infra is built for daily rebalancing, not hourly. But that’s something I need to work on in the near future anyway, so why not start today.
I’ll publish a deeper article on why I want to trade faster, but for now here’s the tweet where I got a first taste of it.


So let’s start with the simplest possible daily implementation and iterate from there.
Spoiler: the results we find by the end are quite decent.
Let’s get into it.