
Dirty Crypto Carry — Part 2
What the data says about funding persistence, fat tails, and why chasing the juiciest rates is not easy

Hey there, Pedma here! Welcome to this ✨ free edition ✨ of the Trading Research Hub’s Newsletter. Each week, I’ll share with you a blend of market research, personal trading experiences, and practical strategies.


If you’re not yet a part of our community, subscribe to stay updated with these more of these posts, and to access all our content.
Hey friends,
In part 1 of our crypto carry experiment, we’ve analyzed how a simple carry strategy performed in crypto, without any prior data analysis.
We went straight for the backtest, and it showed. As with most backtests, that lack the careful thinking about the underlying idea, it didn’t yield much on its own.
So we’ll continue down the logic line to find a solution for this trade.
In this series of articles (oh look how fancy we are talking about series) we will go into multiple steps to gain some intuition about the trade we want to put on first, and then construct the strategy to harvest it. The first thing we’ll do will be to analyze how sticky the funding rate is. If we’re going to be harvesting funding, we want to be able to figure out if what we’re harvesting sticks long enough to compensate for fees and market impact.
Lets start with a simple analysis.
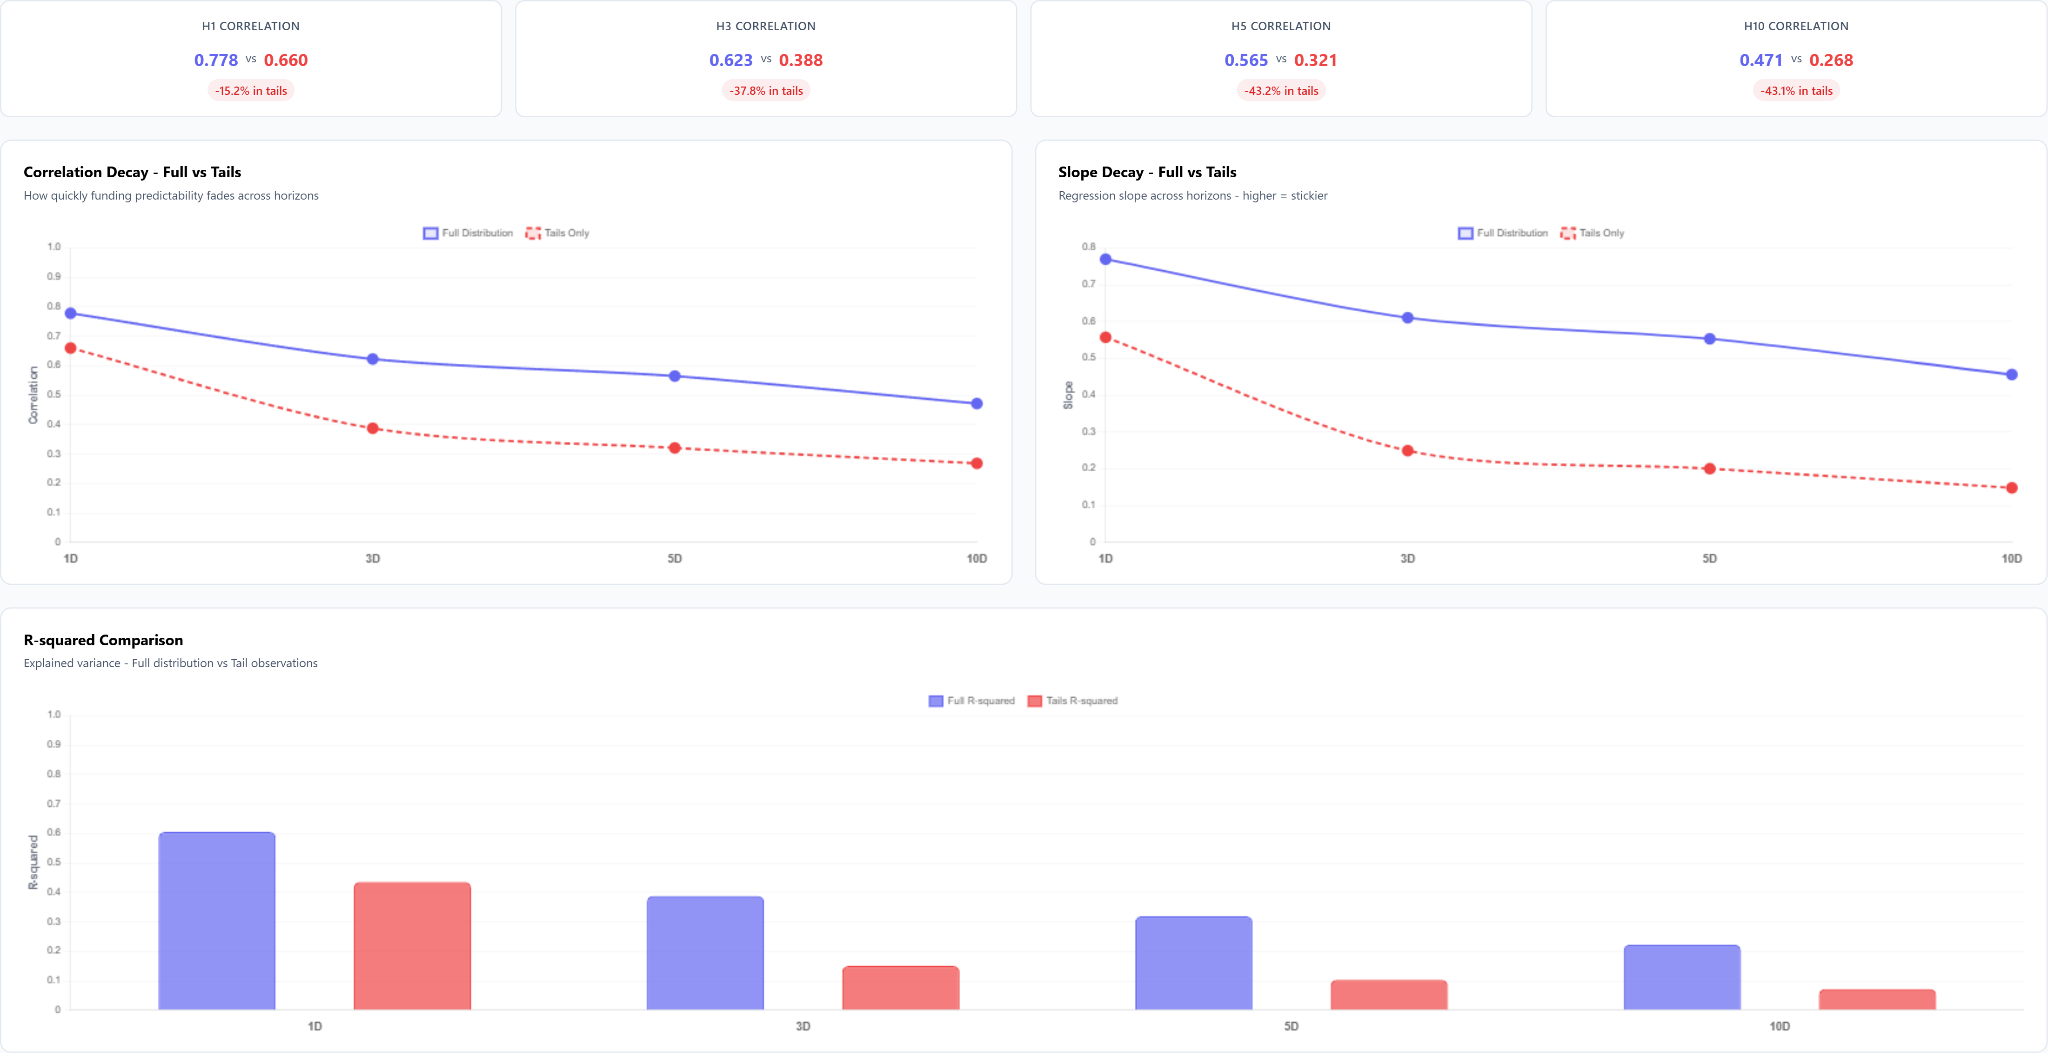
We will analyze if and how current day’s funding is predictive, of funding N days into the future. I’ve removed the tails from this starting analysis as I don’t want those skewing our results for now. We will touch on the tails (no puns intended) later in the article.
We can see that fundings seem to be indeed predictive and kinda sticky.
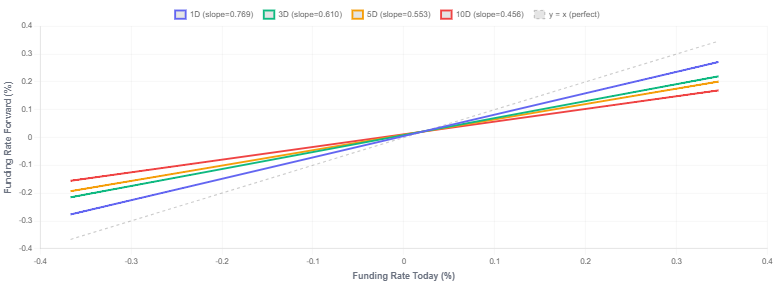
After the 5d mark the correlation begins to decay, and that makes general sense.
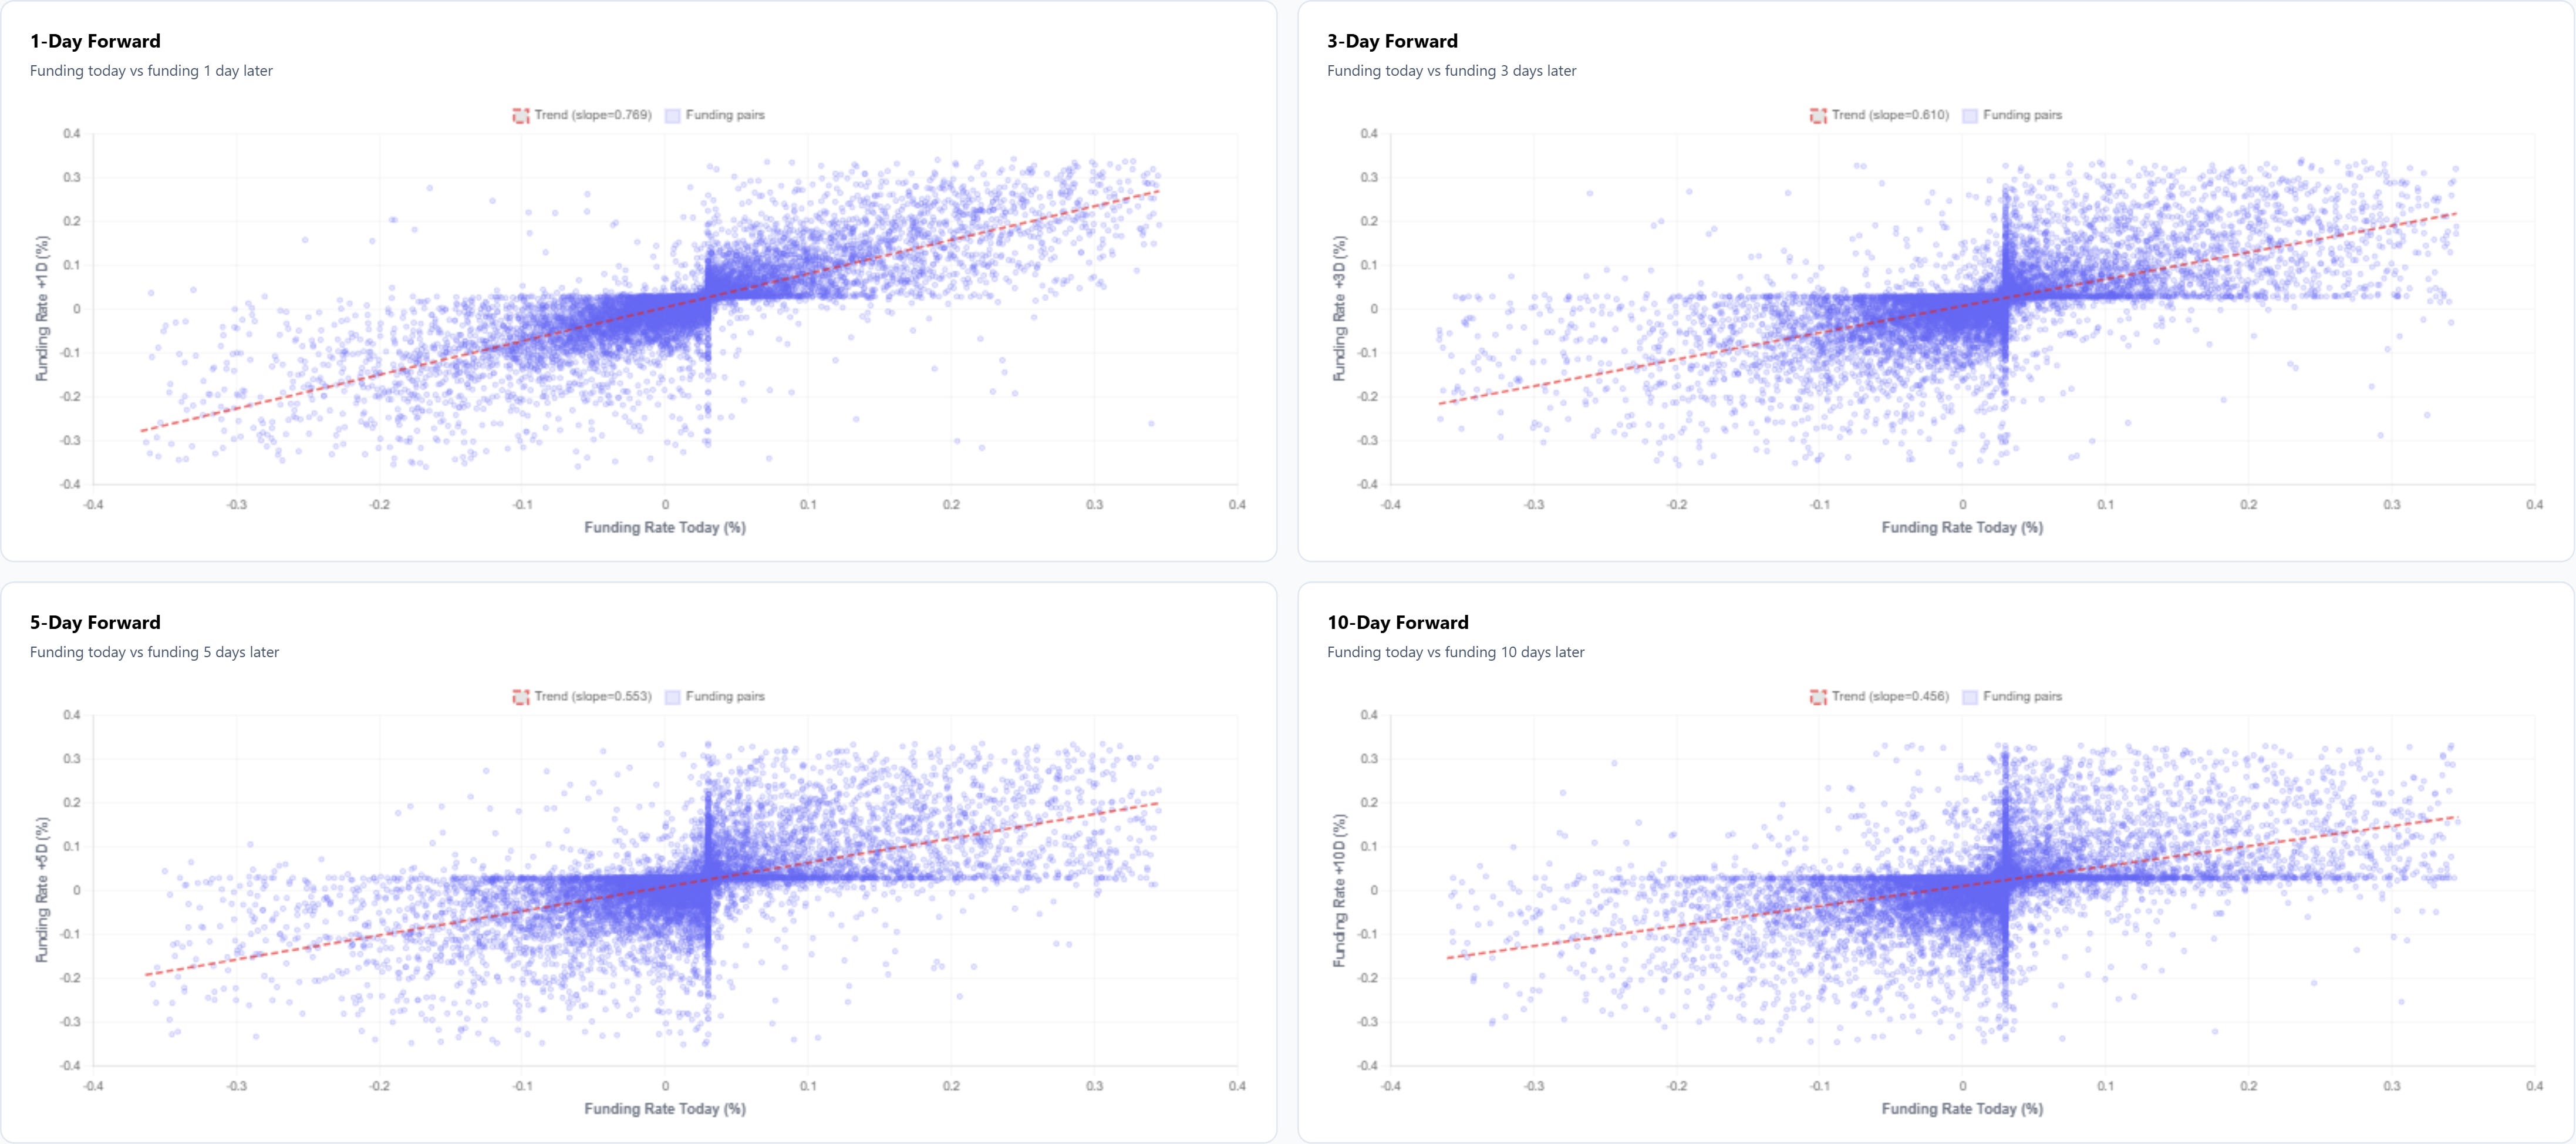
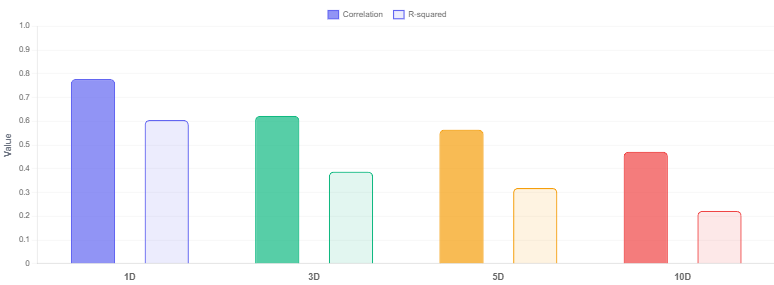
This tells us that if we’re trading within that 1d-5d window we have a reasonable expectation to get paid funding during those days. All that we should care for is how much we’re getting paid vs the costs of trading in an out. Topic for later!
One thing I often see discussed is the tails of the funding. We removed the tails from the starting analysis as they were skewing the results. But my intuition tells me that when funding gets too crazy, it might be more prone to mean revert than normal funding. And it makes sense right? If something is paying so much, everyone’s looking at it because they want it. It’s a beacon of light in the mud.
Now I’ve ran the exact same analysis that I did on top, but now ONLY on the removed tails. We can see that indeed the stickiness is weaker and also decays faster than the “normal” funding readings.
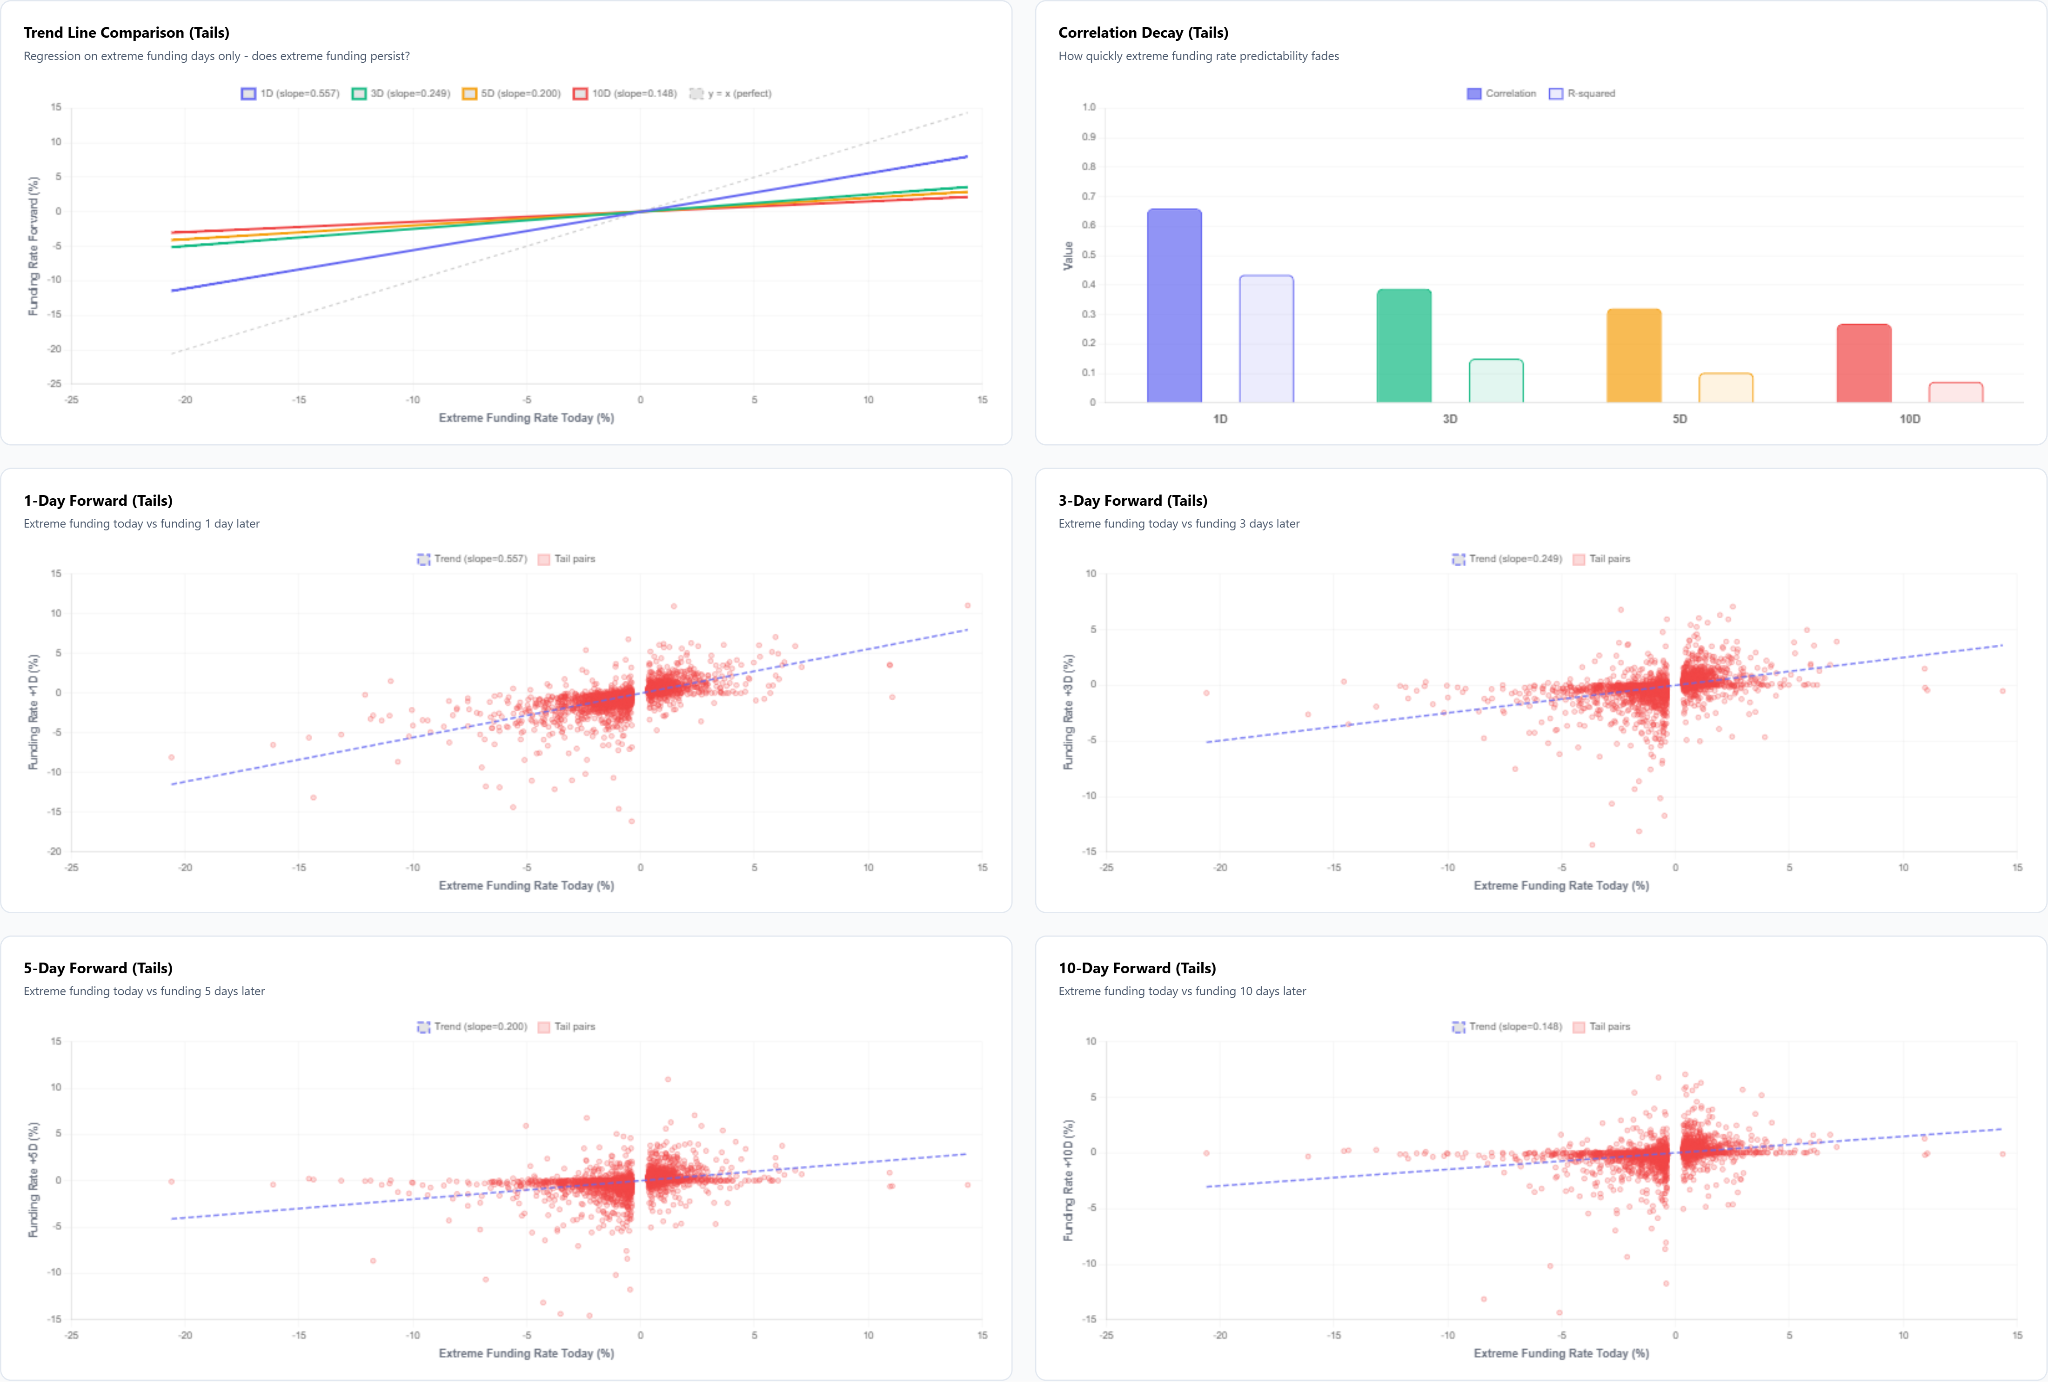
That’s what we expected.
I’ve also traded this myself without any data. I tried to harvest the largest fundings, but they often decayed too fast and forced me to exit of positions that were not paying me anymore, and to be frank, were quite illiquid.
Lets try to prove this though.
I will use dollar volume as a proxy for liquidity. I say proxy because volume isn’t really liquidity innit? But I don’t have book data available at the moment, so dollar volume will do, let’s not be nerds about it. We’re paid to trade not to improve our accuracy by 2% (totally made that number up).
What’s interesting is that although there’s no clear relationship between dollar volume and funding, there’s an interesting behavior at the right end of the tail of dollar volume.
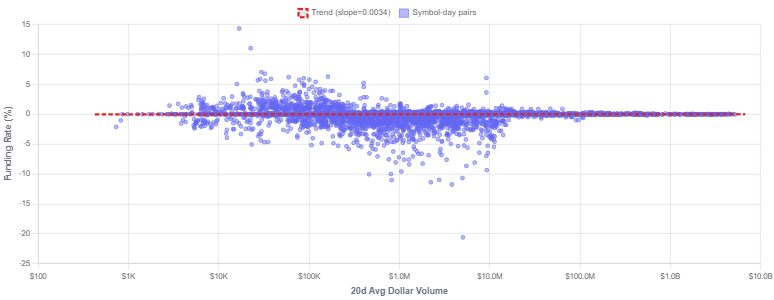
We can see that as volume scales higher, the variance of funding decreases. Goes right into what I was just mentioning from my own observations when I attempted to harvest the largest funding rates. They were usually hard to get because these were smaller coins, and many times, I found myself squeezing some allocation in the books, for little to no profit after it was all and done. Just headaches. Not saying that there’s no opportunity there, just my observation trading it, skill issue perhaps.
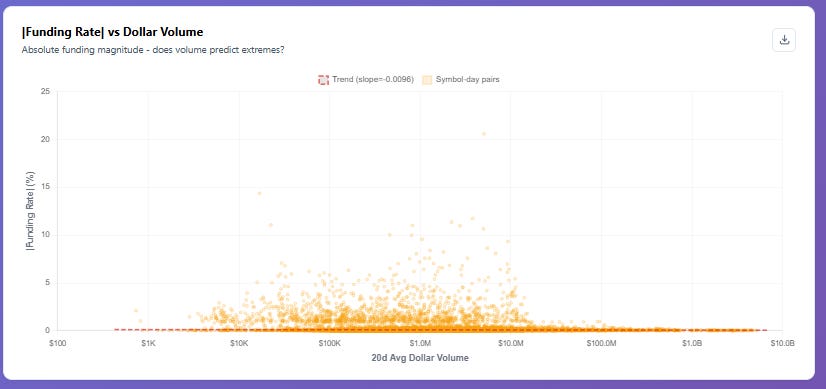
This makes general sense because assets with more volume correlate well with larger market caps, and those tend to not get large deviations from their underlying, after all, they’re harder to move. We can even look at the deciles of funding by volume, and observe that the left tail, and the middle section, are more funky than the higher liquidity stuff.
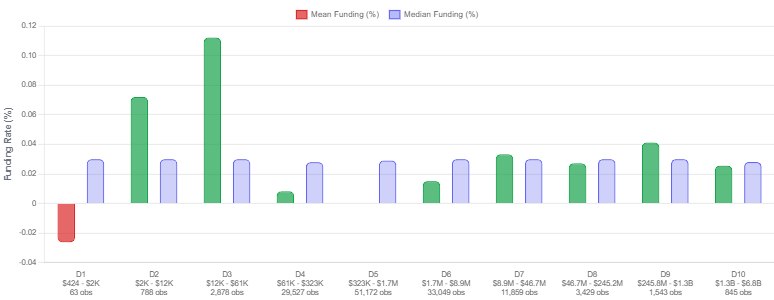
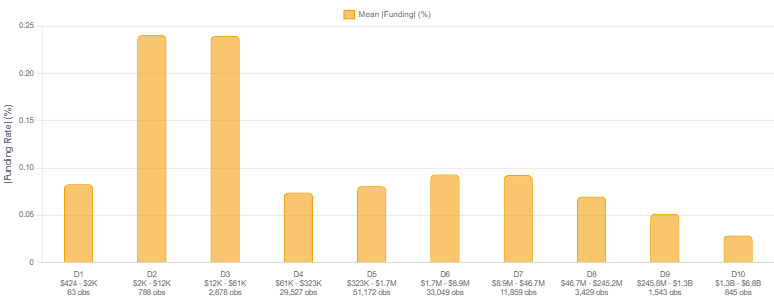
If we look at the outlier frequency by volume decile it shows that the left tail of volume (smaller coins) are a factory of outliers.
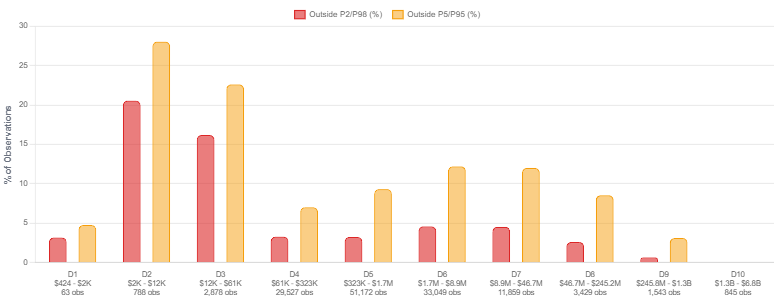
The takeaway of this is that although volume isn’t predictive of the direction of funding, low volume coins have far more extreme funding swings. The variance is quite high at the left tail.
So after all this data we have an idea of what we might want to go for. We don’t want a pure raw funding signal, but rather restrict it to the highest volume traded universe, so that we can harvest more “stable” funding and not be misled by extreme funding readings that don’t help us much.
Now let’s move on with the nerdiness and see how we can make money off of this signal.
But that’s for the next post, this one getting already quite extended.
I hope you’ve enjoyed today’s simple exploration of funding readings.
Disclaimer: The content and information provided by the Trading Research Hub, including all other materials, are for educational and informational purposes only and should not be considered financial advice or a recommendation to buy or sell any type of security or investment. Always conduct your own research and consult with a licensed financial professional before making any investment decisions. Trading and investing can involve significant risk of loss, and you should understand these risks before making any financial decisions.